Darwin Elementary School
Rating
Not Available
Not Available

No Reviews Yet
Find Old Friends From Darwin Elementary School
Use the form below to search for alumni from Darwin Elementary School.
School Description
School Summary and Highlights
- Enrolls 694 preschool and elementary school students from grades PK-8
- Ranks 986th out of 1,366 middle schools in IL.
Additional Contact Information
- Mailing Address: 3116 W Belden Ave, Chicago, IL 60647
- Principal or Admin: M Graciela Shelley
School Operational Details
- Title I EligibleAll students of this school are eligible for participation in authorized programs.
School District Details
- Chicago Public Schools
- Per-Pupil Spending: $10,392
- Graduation Rate: 63.8%
- Dropout Rate: 16.3%
- Students Per Teacher: 17.8
- Enrolled Students: 406,068
Faculty Details and Student Enrollment
Students and Faculty
- Total Students Enrolled: 694
- Total Full Time "Equivalent" Teachers: 38.0
- Average Student-To-Teacher Ratio: 18.3
Students Gender Breakdown
- Males: 367 (52.9%)
- Females: 327 (47.1%)
Free Lunch Student Eligibility Breakdown
- Eligible for Reduced Lunch: 63 (9.1%)
- Eligible for Free Lunch: 605 (87.2%)
- Eligible for Either Reduced or Free Lunch: 668 (96.3%)
Student Enrollment Distribution by Race / Ethnicity
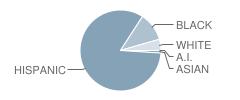
| Number | Percent | |
|---|---|---|
| American Indian | 1 | 0.1% |
| Black | 79 | 11.4% |
| Asian | 6 | 0.9% |
| Hispanic | 577 | 83.1% |
| White | 31 | 4.5% |
Number of Students Per Grade
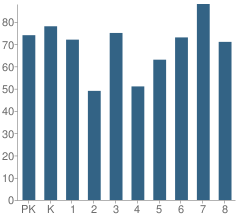
| Number | Percent | |
|---|---|---|
| Pre-Kindergarten | 74 | 10.7% |
| Kindergarten | 78 | 11.2% |
| 1st Grade | 72 | 10.4% |
| 2nd Grade | 49 | 7.1% |
| 3rd Grade | 75 | 10.8% |
| 4th Grade | 51 | 7.3% |
| 5th Grade | 63 | 9.1% |
| 6th Grade | 73 | 10.5% |
| 7th Grade | 88 | 12.7% |
| 8th Grade | 71 | 10.2% |
Attendance, Graduation, and Dropout Rates (2010)
Attendance Rate
School:
94.6%
District:
91.5%
State:
93.9%
Source: IL Department of Education, Source: NCES 2009-2010
School Ratings and Reviews
Be The First To Review Darwin Elementary School!
School Map and Similar Schools Nearby
Click to Activate Map of Nearby School Campuses
Private
Public
This School
Similar Schools Nearby
| Goethe Elementary School PK-8 | 742 Students | 0.6 miles away | Not Yet Rated | |
| Yates Elementary School PK-8 | 761 Students | 0.7 miles away | Not Yet Rated | |
| Brentano Elementary Math & Science Academy PK-8 | 511 Students | 0.7 miles away |  2 out of 5 | |
| Chase Elementary School PK-8 | 497 Students | 0.7 miles away | Not Yet Rated | |
| Funston Elementary School PK-7 | 587 Students | 0.7 miles away |  5 out of 5 | |
| Avondale Elementary School PK-5 | 711 Students | 0.8 miles away | Not Yet Rated | |
| Monroe Elementary School PK-8 | 1,228 Students | 0.8 miles away | Not Yet Rated | |
| Mozart Elementary School PK-6 | 859 Students | 0.9 miles away |  1 out of 5 | |
| Moos Elementary School PK-8 | 502 Students | 0.9 miles away | Not Yet Rated | |
| Stowe Elementary School PK-8 | 961 Students | 0.9 miles away |  3 out of 5 | |
Compare This School To Nearby Schools ->
School Community Forum

Join a discussion about Darwin Elementary School and talk to others in the community including students, parents, teachers, and administrators.
Popular Discussion Topics
- Admissions and Registration Questions (e.g. Dress Code and Discipline Policy)
- School Calendar and Upcoming Events (e.g. Graduation)
- After School Programs, Extracurricular Activities, and Athletics (e.g. Football)
- News and Announcements (e.g. Yearbook and Class Supply List Details)
- Graduate and Alumni Events (e.g. Organizing Class Reunions)
Navigation
Can't Find What You Are Looking For?
Rankings
Nearby Cities
Sponsored Links
K-12 Articles

Assisting Students to Overcome Test Anxiety
Every human copes with anxiety at one time or another. It is a basic emotion that we feel when...
Every human copes with anxiety at one time or another. It is a basic emotion that we feel when...

Helping Your Learning Disabled Child
Thousands of children in America struggle to learn on a daily basis. Many of them have invisible...
Thousands of children in America struggle to learn on a daily basis. Many of them have invisible...

Se Hablan Otras Idiomas?
In the late 1990s, the Salem-Keizer school district in Oregon began requiring every student in its...
In the late 1990s, the Salem-Keizer school district in Oregon began requiring every student in its...