Eberhart Elementary School
Rating
Not Available
Not Available

No Reviews Yet
Find Old Friends From Eberhart Elementary School
Use the form below to search for alumni from Eberhart Elementary School.
School Description
School Summary and Highlights
- Enrolls 1,800 preschool and elementary school students from grades PK-8
- Ranks 991st out of 1,366 middle schools in IL.
Additional Contact Information
- Mailing Address: 3400 W 65th Pl, Chicago, IL 60629
- Principal or Admin: Nneka H Gunn
School Operational Details
- Title I EligibleAll students of this school are eligible for participation in authorized programs.
School District Details
- Chicago Public Schools
- Per-Pupil Spending: $10,392
- Graduation Rate: 63.8%
- Dropout Rate: 16.3%
- Students Per Teacher: 17.8
- Enrolled Students: 406,068
Faculty Details and Student Enrollment
Students and Faculty
- Total Students Enrolled: 1,800
- Total Full Time "Equivalent" Teachers: 89.0
- Average Student-To-Teacher Ratio: 20.2
Students Gender Breakdown
- Males: 918 (51.0%)
- Females: 882 (49.0%)
Free Lunch Student Eligibility Breakdown
- Eligible for Reduced Lunch: 140 (7.8%)
- Eligible for Free Lunch: 1,639 (91.1%)
- Eligible for Either Reduced or Free Lunch: 1,779 (98.8%)
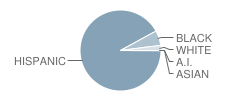
Student Enrollment Distribution by Race / Ethnicity
| Number | Percent | |
|---|---|---|
| American Indian | 1 | 0.06% |
| Black | 107 | 5.9% |
| Asian | 1 | 0.06% |
| Hispanic | 1,655 | 91.9% |
| White | 36 | 2.0% |
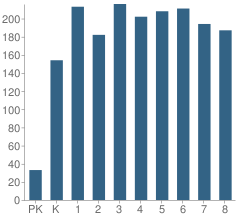
Number of Students Per Grade
| Number | Percent | |
|---|---|---|
| Pre-Kindergarten | 33 | 1.8% |
| Kindergarten | 154 | 8.6% |
| 1st Grade | 213 | 11.8% |
| 2nd Grade | 182 | 10.1% |
| 3rd Grade | 216 | 12.0% |
| 4th Grade | 202 | 11.2% |
| 5th Grade | 208 | 11.6% |
| 6th Grade | 211 | 11.7% |
| 7th Grade | 194 | 10.8% |
| 8th Grade | 187 | 10.4% |
Attendance, Graduation, and Dropout Rates (2010)
Attendance Rate
School:
95.6%
District:
91.5%
State:
93.9%
Source: IL Department of Education, Source: NCES 2009-2010
School Ratings and Reviews
Be The First To Review Eberhart Elementary School!
School Map and Similar Schools Nearby
Click to Activate Map of Nearby School Campuses
Private
Public
This School
Similar Schools Nearby
| Marquette Elementary School PK-8 | 1,501 Students | 0.6 miles away |  1 out of 5 | |
| Tarkington Elementary School PK-8 | 1,096 Students | 0.8 miles away | Not Yet Rated | |
| Hurley Elementary School PK-8 | 1,034 Students | 0.8 miles away | Not Yet Rated | |
| Tonti Elementary School KG-5 | 901 Students | 0.9 miles away | Not Yet Rated | |
| Fairfield Elementary Academy KG-8 | 656 Students | 0.9 miles away | Not Yet Rated | |
| Mckay Elementary School PK-8 | 1,037 Students | 1.0 miles away | Not Yet Rated | |
| Peck Elementary School PK-8 | 1,564 Students | 1.0 miles away | Not Yet Rated | |
| Lee Elementary School PK-8 | 1,080 Students | 1.1 miles away | Not Yet Rated | |
| Morrill Elementary Math & Science School PK-8 | 913 Students | 1.2 miles away | Not Yet Rated | |
| Sandoval Elementary School PK-5 | 1,180 Students | 1.2 miles away | Not Yet Rated | |
Compare This School To Nearby Schools ->
School Community Forum

Join a discussion about Eberhart Elementary School and talk to others in the community including students, parents, teachers, and administrators.
Popular Discussion Topics
- Admissions and Registration Questions (e.g. Dress Code and Discipline Policy)
- School Calendar and Upcoming Events (e.g. Graduation)
- After School Programs, Extracurricular Activities, and Athletics (e.g. Football)
- News and Announcements (e.g. Yearbook and Class Supply List Details)
- Graduate and Alumni Events (e.g. Organizing Class Reunions)
Navigation
Can't Find What You Are Looking For?
Rankings
Nearby Cities
Sponsored Links
K-12 Articles

How to Get the Best Supplies for Your Money
School supply lists can seem unending, and the price can add up very quickly. But do we really...
School supply lists can seem unending, and the price can add up very quickly. But do we really...

Imho
I was watching Headline News’s news ticker when I read something that made me LOL. The ticker said...
I was watching Headline News’s news ticker when I read something that made me LOL. The ticker said...

School's out for Recess
Recess used to be the best part of school; that and lunch. But today, a shocking two-thirds of...
Recess used to be the best part of school; that and lunch. But today, a shocking two-thirds of...