Ebinger Elementary School
Rating
Not Available
Not Available

No Reviews Yet
Find Old Friends From Ebinger Elementary School
Use the form below to search for alumni from Ebinger Elementary School.
School Description
School Summary and Highlights
- Enrolls 607 preschool and elementary school students from grades PK-8
- Ranks 469th out of 1,366 middle schools in IL.
Additional Contact Information
- Mailing Address: 7350 W Pratt Ave, Chicago, IL 60631
- Principal or Admin: Marilyn Leboy
School District Details
- Chicago Public Schools
- Per-Pupil Spending: $10,392
- Graduation Rate: 63.8%
- Dropout Rate: 16.3%
- Students Per Teacher: 17.8
- Enrolled Students: 406,068
Faculty Details and Student Enrollment
Students and Faculty
- Total Students Enrolled: 607
- Total Full Time "Equivalent" Teachers: 31.0
- Average Student-To-Teacher Ratio: 19.6
Students Gender Breakdown
- Males: 316 (52.1%)
- Females: 291 (47.9%)
Free Lunch Student Eligibility Breakdown
- Eligible for Reduced Lunch: 33 (5.4%)
- Eligible for Free Lunch: 67 (11.0%)
- Eligible for Either Reduced or Free Lunch: 100 (16.5%)
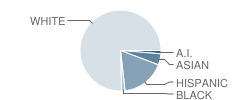
Student Enrollment Distribution by Race / Ethnicity
| Number | Percent | |
|---|---|---|
| American Indian | 8 | 1.3% |
| Black | 8 | 1.3% |
| Asian | 27 | 4.4% |
| Hispanic | 106 | 17.5% |
| White | 458 | 75.5% |
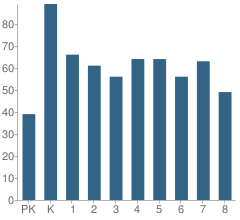
Number of Students Per Grade
| Number | Percent | |
|---|---|---|
| Pre-Kindergarten | 39 | 6.4% |
| Kindergarten | 89 | 14.7% |
| 1st Grade | 66 | 10.9% |
| 2nd Grade | 61 | 10.0% |
| 3rd Grade | 56 | 9.2% |
| 4th Grade | 64 | 10.5% |
| 5th Grade | 64 | 10.5% |
| 6th Grade | 56 | 9.2% |
| 7th Grade | 63 | 10.4% |
| 8th Grade | 49 | 8.1% |
Attendance, Graduation, and Dropout Rates (2010)
Attendance Rate
School:
95.6%
District:
91.5%
State:
93.9%
Source: IL Department of Education, Source: NCES 2009-2010
School Ratings and Reviews
Be The First To Review Ebinger Elementary School!
School Map and Similar Schools Nearby
Click to Activate Map of Nearby School Campuses
Private
Public
This School
Similar Schools Nearby
| Edison Park Elementary School PK-8 | 339 Students | 0.7 miles away | Not Yet Rated | |
| Stock Elementary School PK | 269 Students | 0.9 miles away |  5 out of 5 | - |
| Onahan Elementary School PK-8 | 634 Students | 1.2 miles away | 5 out of 5 | |
| Norwood Park Elementary School PK-8 | 376 Students | 1.2 miles away | Not Yet Rated | |
| Theodore Roosevelt Elementary School KG-5 | 639 Students | 1.3 miles away | Not Yet Rated | |
| Eugene Field Elementary School KG-5 | 658 Students | 1.3 miles away | Not Yet Rated | |
| Clarence E Culver School PK-8 | 536 Students | 1.6 miles away | Not Yet Rated | |
| Wildwood Elementary School KG-8 | 374 Students | 1.7 miles away | Not Yet Rated | |
| Oriole Park Elementary School PK-8 | 648 Students | 1.8 miles away | Not Yet Rated | |
| George Washington Elementary School KG-5 | 619 Students | 1.8 miles away | Not Yet Rated | |
Compare This School To Nearby Schools ->
School Community Forum

Join a discussion about Ebinger Elementary School and talk to others in the community including students, parents, teachers, and administrators.
Popular Discussion Topics
- Admissions and Registration Questions (e.g. Dress Code and Discipline Policy)
- School Calendar and Upcoming Events (e.g. Graduation)
- After School Programs, Extracurricular Activities, and Athletics (e.g. Football)
- News and Announcements (e.g. Yearbook and Class Supply List Details)
- Graduate and Alumni Events (e.g. Organizing Class Reunions)
Navigation
Can't Find What You Are Looking For?
Rankings
Nearby Cities
Sponsored Links
K-12 Articles

Middle School Homework and Study Habits
The report cards came home and you’re disappointed with your child’s scores. You know he has the...
The report cards came home and you’re disappointed with your child’s scores. You know he has the...

The Adolescent Monster
“What happened to my sweet little baby?” Every parent has or will ask that sometime during the...
“What happened to my sweet little baby?” Every parent has or will ask that sometime during the...

Those Pesky Little Transitions
Transitions are rarely easy, yet we have to encounter them every day of our lives. For school-aged...
Transitions are rarely easy, yet we have to encounter them every day of our lives. For school-aged...