Gillespie Elementary School
Rating
Not Available
Not Available

No Reviews Yet
Find Old Friends From Gillespie Elementary School
Use the form below to search for alumni from Gillespie Elementary School.
School Description
School Summary and Highlights
- Enrolls 534 preschool and elementary school students from grades PK-8
- Ranks 1249th out of 1,366 middle schools in IL.
Additional Contact Information
- Mailing Address: 9301 S State St, Chicago, IL 60619
- Principal or Admin: Michelle Willis
School Operational Details
- Title I EligibleAll students of this school are eligible for participation in authorized programs.
School District Details
- Chicago Public Schools
- Per-Pupil Spending: $10,392
- Graduation Rate: 63.8%
- Dropout Rate: 16.3%
- Students Per Teacher: 17.8
- Enrolled Students: 406,068
Faculty Details and Student Enrollment
Students and Faculty
- Total Students Enrolled: 534
- Total Full Time "Equivalent" Teachers: 28.0
- Average Student-To-Teacher Ratio: 19.1
Students Gender Breakdown
- Males: 293 (54.9%)
- Females: 241 (45.1%)
Free Lunch Student Eligibility Breakdown
- Eligible for Reduced Lunch: 35 (6.6%)
- Eligible for Free Lunch: 484 (90.6%)
- Eligible for Either Reduced or Free Lunch: 519 (97.2%)
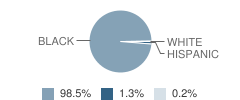
Student Enrollment Distribution by Race / Ethnicity
| Number | Percent | |
|---|---|---|
| American Indian | - | - |
| Black | 526 | 98.5% |
| Asian | - | - |
| Hispanic | 7 | 1.3% |
| White | 1 | 0.2% |
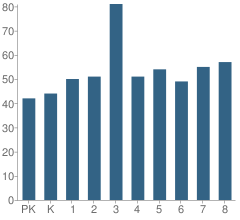
Number of Students Per Grade
| Number | Percent | |
|---|---|---|
| Pre-Kindergarten | 42 | 7.9% |
| Kindergarten | 44 | 8.2% |
| 1st Grade | 50 | 9.4% |
| 2nd Grade | 51 | 9.6% |
| 3rd Grade | 81 | 15.2% |
| 4th Grade | 51 | 9.6% |
| 5th Grade | 54 | 10.1% |
| 6th Grade | 49 | 9.2% |
| 7th Grade | 55 | 10.3% |
| 8th Grade | 57 | 10.7% |
Attendance, Graduation, and Dropout Rates (2010)
Attendance Rate
School:
93.0%
District:
91.5%
State:
93.9%
Teacher Credentials (2010)
Percent of Classes Not Taught by Highly Qualified Teachers
School:
4.3%
District:
3.0%
State:
0.7%
Source: IL Department of Education, Source: NCES 2009-2010
School Ratings and Reviews
Be The First To Review Gillespie Elementary School!
School Map and Similar Schools Nearby
Click to Activate Map of Nearby School Campuses
Private
Public
This School
Similar Schools Nearby
| Turner-Drew Elementary Language Academy KG-8 | 365 Students | 0.3 miles away | Not Yet Rated | |
| Mcdade Elementary Classical School KG-6 | 188 Students | 0.7 miles away | Not Yet Rated | |
| Kipling Elementary School KG-8 | 434 Students | 0.8 miles away | Not Yet Rated | |
| Burnside Elementary Scholastic Academy PK-8 | 734 Students | 0.9 miles away |  5 out of 5 | |
| Neil Elementary School KG-8 | 352 Students | 1.0 miles away | Not Yet Rated | |
| Evers Elementary School PK-8 | 374 Students | 1.0 miles away | Not Yet Rated | |
| Ryder Elementary Math & Science Special School PK-8 | 311 Students | 1.1 miles away |  3 out of 5 | |
| Bennett Elementary School PK-8 | 610 Students | 1.1 miles away | 5 out of 5 | |
| Nkrumah Academy Elementary KG-2 | 109 Students | 1.1 miles away | Not Yet Rated | - |
| Fernwood Elementary School PK-8 | 355 Students | 1.3 miles away |  1 out of 5 | |
Compare This School To Nearby Schools ->
School Community Forum

Join a discussion about Gillespie Elementary School and talk to others in the community including students, parents, teachers, and administrators.
Popular Discussion Topics
- Admissions and Registration Questions (e.g. Dress Code and Discipline Policy)
- School Calendar and Upcoming Events (e.g. Graduation)
- After School Programs, Extracurricular Activities, and Athletics (e.g. Football)
- News and Announcements (e.g. Yearbook and Class Supply List Details)
- Graduate and Alumni Events (e.g. Organizing Class Reunions)
Navigation
Can't Find What You Are Looking For?
Rankings
Nearby Cities
Sponsored Links
K-12 Articles

Where in the World is Carmen Sandiego?
One of the sensations on YouTube highlights the state of our education system. The spot was...
One of the sensations on YouTube highlights the state of our education system. The spot was...

Attend Your Teen's Holiday Parties
Christmas and New Years are coming, and with them Christmas and New Years Eve parties. At many of...
Christmas and New Years are coming, and with them Christmas and New Years Eve parties. At many of...

Adolescents, Sleep and Learning
Recently, adolescent’s sleep habits have been in the news. Research has shown that adolescents need...
Recently, adolescent’s sleep habits have been in the news. Research has shown that adolescents need...