Harvard Elementary School
Rating
Not Available
Not Available

3 out of 5 | 2 Reviews
Find Old Friends From Harvard Elementary School
Use the form below to search for alumni from Harvard Elementary School.
School Description
School Summary and Highlights
- Enrolls 460 preschool and elementary school students from grades PK-8
- Ranks 1233rd out of 1,366 middle schools in IL.
Additional Contact Information
- Mailing Address: 7525 S Harvard, Chicago, IL 60620
- Principal or Admin: Andre Cowling
School Operational Details
- Title I EligibleAll students of this school are eligible for participation in authorized programs.
School District Details
- Chicago Public Schools
- Per-Pupil Spending: $10,392
- Graduation Rate: 63.8%
- Dropout Rate: 16.3%
- Students Per Teacher: 17.8
- Enrolled Students: 406,068
Faculty Details and Student Enrollment
Students and Faculty
- Total Students Enrolled: 460
- Total Full Time "Equivalent" Teachers: 28.0
- Average Student-To-Teacher Ratio: 16.4
Students Gender Breakdown
- Males: 230 (50.0%)
- Females: 230 (50.0%)
Free Lunch Student Eligibility Breakdown
- Eligible for Reduced Lunch: 12 (2.6%)
- Eligible for Free Lunch: 445 (96.7%)
- Eligible for Either Reduced or Free Lunch: 457 (99.3%)
Student Enrollment Distribution by Race / Ethnicity
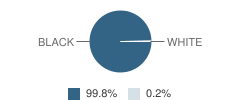
| Number | Percent | |
|---|---|---|
| American Indian | - | - |
| Black | 459 | 99.8% |
| Asian | - | - |
| Hispanic | - | - |
| White | 1 | 0.2% |
Number of Students Per Grade
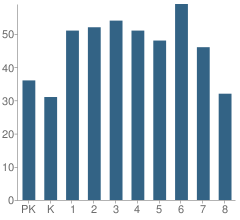
| Number | Percent | |
|---|---|---|
| Pre-Kindergarten | 36 | 7.8% |
| Kindergarten | 31 | 6.7% |
| 1st Grade | 51 | 11.1% |
| 2nd Grade | 52 | 11.3% |
| 3rd Grade | 54 | 11.7% |
| 4th Grade | 51 | 11.1% |
| 5th Grade | 48 | 10.4% |
| 6th Grade | 59 | 12.8% |
| 7th Grade | 46 | 10.0% |
| 8th Grade | 32 | 7.0% |
Attendance, Graduation, and Dropout Rates (2010)
Attendance Rate
School:
94.3%
District:
91.5%
State:
93.9%
Source: IL Department of Education, Source: NCES 2009-2010
School Ratings and Reviews
Overall Rating: 3

3 out of 5 | 2 Reviews
The Overall Rating is the school's average rating from parents, students, school faculty and staff. The highest rating is five apples and the lowest is one apple.
Share Your Review About This School
2 reviews for Harvard Elementary School
- Reviewed by Student on August 08, 2009
- Rating:
 (5 / 5) Flag as inappropriate
 - The School IS Very Awsome Better Princalpal,Better Staffs most of all Better Test Scores Better everything I want to congradulate The new Princapal Mr.Cowling For Doing An Excellent Job With Students And school
- Reviewed by Parent/Guardian on March 06, 2007
- Rating:
 (1 / 5) Flag as inappropriate
 - This school and it's principal has major flaws such as:the principal does not take proper measures for misbehaved children,instead he punishes all student's which then makes the well behaved children think that no matter how well behaved or how well their doing in school that their getting the bad end of the stick regardless which from that point makes a lot of those children turn towards the ill road.Another issue that is facing our children is that a lot of the teachers dont put forth the neccessary efforts to go the extra mile with the children.This school has a long way to go as far as test scores,and just obtaining the basic know how of certain subjects. The violence and abuse from teachers to students,and from student to student is outrageous.sOME OF THE TEACHERS VERBALLY ABUSE THE CHILDREN by calling them stupid, which then lowers their self-esteem a lot more than it already is.We as a society need to put forth more effort toward the education of our children, and their safety. I feel that a lot of issues can be rectified with a better principal and more dedicated teachers and parents to the educatin of our future.
School Map and Similar Schools Nearby
Click to Activate Map of Nearby School Campuses
Private
Public
This School
Similar Schools Nearby
| Yale Elementary School PK-8 | 247 Students | 0.6 miles away |  5 out of 5 | |
| Westcott Elementary School PK-8 | 531 Students | 0.6 miles away |  1 out of 5 | |
| Deneen Elementary School PK-8 | 489 Students | 0.6 miles away | 5 out of 5 | |
| Oglesby Elementary School PK-8 | 519 Students | 0.7 miles away | 1 out of 5 | |
| Hinton Elementary School PK-8 | 377 Students | 0.7 miles away |  4 out of 5 | |
| Parker Elementary Community Academy PK-8 | 679 Students | 0.8 miles away | Not Yet Rated | |
| Ruggles Elementary School PK-8 | 451 Students | 0.8 miles away | 5 out of 5 | |
| Stagg Elementary School PK-8 | 558 Students | 0.8 miles away | Not Yet Rated | |
| Lenart Elementary Regional Gifted Center School PK-8 | 325 Students | 0.8 miles away | Not Yet Rated | |
| Guggenheim Elementary School PK-8 | 262 Students | 1.0 miles away | 5 out of 5 | |
Compare This School To Nearby Schools ->
School Community Forum

Join a discussion about Harvard Elementary School and talk to others in the community including students, parents, teachers, and administrators.
Popular Discussion Topics
- Admissions and Registration Questions (e.g. Dress Code and Discipline Policy)
- School Calendar and Upcoming Events (e.g. Graduation)
- After School Programs, Extracurricular Activities, and Athletics (e.g. Football)
- News and Announcements (e.g. Yearbook and Class Supply List Details)
- Graduate and Alumni Events (e.g. Organizing Class Reunions)
Navigation
Can't Find What You Are Looking For?
Rankings
Nearby Cities
Sponsored Links
K-12 Articles

Teachers Packing Heat
After the recent school shootings (and thwarted school shootings) in the past month-just as after...
After the recent school shootings (and thwarted school shootings) in the past month-just as after...

Nothing New Under the Sun
“I had to go through the same thing when I went to school.” Every parent has uttered this phrase,...
“I had to go through the same thing when I went to school.” Every parent has uttered this phrase,...

Internet Safety for Kids of All Ages
Kids are being introduced to the Internet at a very young age. Research for homework and school...
Kids are being introduced to the Internet at a very young age. Research for homework and school...