Morrill Elementary Math & Science School
Rating
Not Available
Not Available

No Reviews Yet
Find Old Friends From Morrill Elementary Math & Science School
Use the form below to search for alumni from Morrill Elementary Math & Science School.
School Description
School Summary and Highlights
- Enrolls 913 preschool and elementary school students from grades PK-8
- Ranks 1172nd out of 1,366 middle schools in IL.
Additional Contact Information
- Mailing Address: 6011 S Rockwell St, Chicago, IL 60629
- Principal or Admin: Patricia A Costello
School Operational Details
- Title I EligibleAll students of this school are eligible for participation in authorized programs.
School District Details
- Chicago Public Schools
- Per-Pupil Spending: $10,392
- Graduation Rate: 63.8%
- Dropout Rate: 16.3%
- Students Per Teacher: 17.8
- Enrolled Students: 406,068
Faculty Details and Student Enrollment
Students and Faculty
- Total Students Enrolled: 913
- Total Full Time "Equivalent" Teachers: 46.0
- Average Student-To-Teacher Ratio: 19.9
Students Gender Breakdown
- Males: 479 (52.5%)
- Females: 434 (47.5%)
Free Lunch Student Eligibility Breakdown
- Eligible for Reduced Lunch: 22 (2.4%)
- Eligible for Free Lunch: 863 (94.5%)
- Eligible for Either Reduced or Free Lunch: 885 (96.9%)
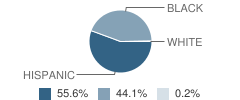
Student Enrollment Distribution by Race / Ethnicity
| Number | Percent | |
|---|---|---|
| American Indian | - | - |
| Black | 403 | 44.1% |
| Asian | - | - |
| Hispanic | 508 | 55.6% |
| White | 2 | 0.2% |
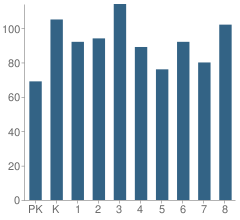
Number of Students Per Grade
| Number | Percent | |
|---|---|---|
| Pre-Kindergarten | 69 | 7.6% |
| Kindergarten | 105 | 11.5% |
| 1st Grade | 92 | 10.1% |
| 2nd Grade | 94 | 10.3% |
| 3rd Grade | 114 | 12.5% |
| 4th Grade | 89 | 9.7% |
| 5th Grade | 76 | 8.3% |
| 6th Grade | 92 | 10.1% |
| 7th Grade | 80 | 8.8% |
| 8th Grade | 102 | 11.2% |
Attendance, Graduation, and Dropout Rates (2010)
Attendance Rate
School:
94.7%
District:
91.5%
State:
93.9%
Source: IL Department of Education, Source: NCES 2009-2010
School Ratings and Reviews
Be The First To Review Morrill Elementary Math & Science School!
School Map and Similar Schools Nearby
Click to Activate Map of Nearby School Campuses
Private
Public
This School
Similar Schools Nearby
| Fairfield Elementary Academy KG-8 | 656 Students | 0.3 miles away | Not Yet Rated | |
| Claremont Academy Elementary School PK-8 | 590 Students | 0.6 miles away |  4.5 out of 5 | |
| Carson Elementary School PK-8 | 1,325 Students | 0.6 miles away | Not Yet Rated | |
| Talman Elementary School PK-8 | 328 Students | 0.7 miles away | Not Yet Rated | |
| Goodlow Elementary Magnet School PK-8 | 520 Students | 0.7 miles away |  1 out of 5 | |
| Marquette Elementary School PK-8 | 1,501 Students | 0.8 miles away | 1 out of 5 | |
| Nightingale Elementary School PK-8 | 1,418 Students | 1.0 miles away | Not Yet Rated | |
| Otoole Elementary School PK-8 | 672 Students | 1.0 miles away | Not Yet Rated | |
| Henderson Elementary School PK-8 | 456 Students | 1.0 miles away | Not Yet Rated | |
| Tonti Elementary School KG-5 | 901 Students | 1.0 miles away | Not Yet Rated | |
Compare This School To Nearby Schools ->
School Community Forum

Join a discussion about Morrill Elementary Math & Science School and talk to others in the community including students, parents, teachers, and administrators.
Popular Discussion Topics
- Admissions and Registration Questions (e.g. Dress Code and Discipline Policy)
- School Calendar and Upcoming Events (e.g. Graduation)
- After School Programs, Extracurricular Activities, and Athletics (e.g. Football)
- News and Announcements (e.g. Yearbook and Class Supply List Details)
- Graduate and Alumni Events (e.g. Organizing Class Reunions)
Navigation
Can't Find What You Are Looking For?
Rankings
Nearby Cities
Sponsored Links
K-12 Articles

Cut the Credit and Save You Some Money
Today's society glorifies a get-it-now mentality. Children learn this early. You probably noticed...
Today's society glorifies a get-it-now mentality. Children learn this early. You probably noticed...

Those Pesky Little Transitions
Transitions are rarely easy, yet we have to encounter them every day of our lives. For school-aged...
Transitions are rarely easy, yet we have to encounter them every day of our lives. For school-aged...

Homework Helps
School has started throughout the country and is well into the first month-some schools are...
School has started throughout the country and is well into the first month-some schools are...