Parkside Elementary Community Academy
Rating
Not Available
Not Available

5 out of 5 | 1 Review
Find Old Friends From Parkside Elementary Community Academy
Use the form below to search for alumni from Parkside Elementary Community Academy.
School Description
School Summary and Highlights
- Enrolls 370 preschool and elementary school students from grades PK-8
- Ranks 1337th out of 1,366 middle schools in IL.
Additional Contact Information
- Mailing Address: 6938 S East End Ave, Chicago, IL 60649
- Principal or Admin: Dorothy Thompson
School Operational Details
- Title I EligibleAll students of this school are eligible for participation in authorized programs.
School District Details
- Chicago Public Schools
- Per-Pupil Spending: $10,392
- Graduation Rate: 63.8%
- Dropout Rate: 16.3%
- Students Per Teacher: 17.8
- Enrolled Students: 406,068
Faculty Details and Student Enrollment
Students and Faculty
- Total Students Enrolled: 370
- Total Full Time "Equivalent" Teachers: 21.0
- Average Student-To-Teacher Ratio: 17.6
Students Gender Breakdown
- Males: 195 (52.7%)
- Females: 175 (47.3%)
Free Lunch Student Eligibility Breakdown
- Eligible for Reduced Lunch: 8 (2.2%)
- Eligible for Free Lunch: 348 (94.1%)
- Eligible for Either Reduced or Free Lunch: 356 (96.2%)
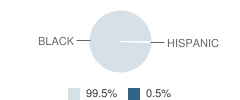
Student Enrollment Distribution by Race / Ethnicity
| Number | Percent | |
|---|---|---|
| American Indian | - | - |
| Black | 368 | 99.5% |
| Asian | - | - |
| Hispanic | 2 | 0.5% |
| White | - | - |
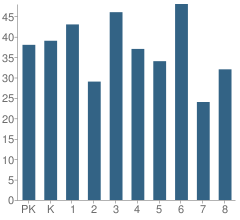
Number of Students Per Grade
| Number | Percent | |
|---|---|---|
| Pre-Kindergarten | 38 | 10.3% |
| Kindergarten | 39 | 10.5% |
| 1st Grade | 43 | 11.6% |
| 2nd Grade | 29 | 7.8% |
| 3rd Grade | 46 | 12.4% |
| 4th Grade | 37 | 10.0% |
| 5th Grade | 34 | 9.2% |
| 6th Grade | 48 | 13.0% |
| 7th Grade | 24 | 6.5% |
| 8th Grade | 32 | 8.6% |
Attendance, Graduation, and Dropout Rates (2010)
Attendance Rate
School:
91.6%
District:
91.5%
State:
93.9%
Teacher Credentials (2010)
Percent of Classes Not Taught by Highly Qualified Teachers
School:
5.6%
District:
3.0%
State:
0.7%
Source: IL Department of Education, Source: NCES 2009-2010
School Ratings and Reviews
Overall Rating: 5

5 out of 5 | 1 Review
The Overall Rating is the school's average rating from parents, students, school faculty and staff. The highest rating is five apples and the lowest is one apple.
Share Your Review About This School
1 review for Parkside Elementary Community Academy
- Reviewed by Former Student on August 28, 2009
- Rating:
 (5 / 5) Flag as inappropriate
 - Parkside is a great school that has very educated students.But Parkside needs to know if a student is in the gifted program and is working on higher grade work and doing it right then they shall be skipped to the next grade if they know more then they need to know in their current grade.
School Map and Similar Schools Nearby
Click to Activate Map of Nearby School Campuses
Private
Public
This School
Similar Schools Nearby
| South Shore Fine Arts Elementary School PK-2 | 159 Students | 0.4 miles away | Not Yet Rated | - |
| Okeeffe Elementary School PK-8 | 642 Students | 0.5 miles away |  5 out of 5 | |
| Bouchet Elementary Math & Science Academy PK-8 | 787 Students | 0.6 miles away |  4 out of 5 | |
| Woodlawn Elementary Community School PK-6 | 217 Students | 0.7 miles away | Not Yet Rated | |
| Madison Elementary School PK-8 | 353 Students | 0.8 miles away | Not Yet Rated | |
| Revere Elementary School PK-8 | 405 Students | 1.0 miles away | Not Yet Rated | |
| Dumas Elementary School PK-8 | 393 Students | 1.0 miles away |  1 out of 5 | |
| Wadsworth Elementary School PK-5 | 286 Students | 1.0 miles away | Not Yet Rated | |
| Carnegie Elementary School PK-8 | 704 Students | 1.1 miles away | Not Yet Rated | |
| Tanner Elementary School PK-8 | 549 Students | 1.3 miles away | Not Yet Rated | |
Compare This School To Nearby Schools ->
School Community Forum

Join a discussion about Parkside Elementary Community Academy and talk to others in the community including students, parents, teachers, and administrators.
Popular Discussion Topics
- Admissions and Registration Questions (e.g. Dress Code and Discipline Policy)
- School Calendar and Upcoming Events (e.g. Graduation)
- After School Programs, Extracurricular Activities, and Athletics (e.g. Football)
- News and Announcements (e.g. Yearbook and Class Supply List Details)
- Graduate and Alumni Events (e.g. Organizing Class Reunions)
Navigation
Can't Find What You Are Looking For?
Rankings
Nearby Cities
Sponsored Links
K-12 Articles

The Cervical Cancer Vaccine
All across North America girls between the ages of 11 and 12 have the opportunity to be vaccinated...
All across North America girls between the ages of 11 and 12 have the opportunity to be vaccinated...

The Importance of Ninth Grade
Students who are entering ninth grade do not realize the importance of the critical decisions they...
Students who are entering ninth grade do not realize the importance of the critical decisions they...

The Difference Between Boys and Girls
Boys and girls are different. Give a toddler girl a G.I. Joe and she'll probably try to mother it....
Boys and girls are different. Give a toddler girl a G.I. Joe and she'll probably try to mother it....