Tanner Elementary School
Rating
Not Available
Not Available

No Reviews Yet
Find Old Friends From Tanner Elementary School
Use the form below to search for alumni from Tanner Elementary School.
School Description
School Summary and Highlights
- Enrolls 549 preschool and elementary school students from grades PK-8
- Ranks 1354th out of 1,366 middle schools in IL.
Additional Contact Information
- Mailing Address: 7350 S Evans Ave, Chicago, IL 60619
- Principal or Admin: Mona Miller
School Operational Details
- Title I EligibleAll students of this school are eligible for participation in authorized programs.
School District Details
- Chicago Public Schools
- Per-Pupil Spending: $10,392
- Graduation Rate: 63.8%
- Dropout Rate: 16.3%
- Students Per Teacher: 17.8
- Enrolled Students: 406,068
Faculty Details and Student Enrollment
Students and Faculty
- Total Students Enrolled: 549
- Total Full Time "Equivalent" Teachers: 28.0
- Average Student-To-Teacher Ratio: 19.6
Students Gender Breakdown
- Males: 297 (54.1%)
- Females: 252 (45.9%)
Free Lunch Student Eligibility Breakdown
- Eligible for Reduced Lunch: 11 (2.0%)
- Eligible for Free Lunch: 489 (89.1%)
- Eligible for Either Reduced or Free Lunch: 500 (91.1%)
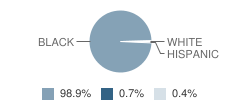
Student Enrollment Distribution by Race / Ethnicity
| Number | Percent | |
|---|---|---|
| American Indian | - | - |
| Black | 543 | 98.9% |
| Asian | - | - |
| Hispanic | 4 | 0.7% |
| White | 2 | 0.4% |
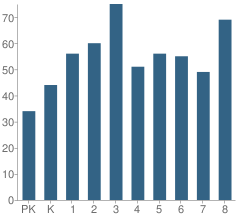
Number of Students Per Grade
| Number | Percent | |
|---|---|---|
| Pre-Kindergarten | 34 | 6.2% |
| Kindergarten | 44 | 8.0% |
| 1st Grade | 56 | 10.2% |
| 2nd Grade | 60 | 10.9% |
| 3rd Grade | 75 | 13.7% |
| 4th Grade | 51 | 9.3% |
| 5th Grade | 56 | 10.2% |
| 6th Grade | 55 | 10.0% |
| 7th Grade | 49 | 8.9% |
| 8th Grade | 69 | 12.6% |
Attendance, Graduation, and Dropout Rates (2010)
Attendance Rate
School:
89.6%
District:
91.5%
State:
93.9%
Source: IL Department of Education, Source: NCES 2009-2010
School Ratings and Reviews
Be The First To Review Tanner Elementary School!
School Map and Similar Schools Nearby
Click to Activate Map of Nearby School Campuses
Private
Public
This School
Similar Schools Nearby
| Revere Elementary School PK-8 | 405 Students | 0.4 miles away | Not Yet Rated | |
| Park Manor Elementary School PK-8 | 367 Students | 0.5 miles away | Not Yet Rated | |
| Madison Elementary School PK-8 | 353 Students | 0.8 miles away | Not Yet Rated | |
| Ruggles Elementary School PK-8 | 451 Students | 0.8 miles away |  5 out of 5 | |
| Deneen Elementary School PK-8 | 489 Students | 0.9 miles away | 5 out of 5 | |
| Dumas Elementary School PK-8 | 393 Students | 0.9 miles away |  1 out of 5 | |
| South Shore Fine Arts Elementary School PK-2 | 159 Students | 1.0 miles away | Not Yet Rated | - |
| Mccosh Elementary School PK-8 | 563 Students | 1.0 miles away | Not Yet Rated | |
| Brownell Elementary School PK-6 | 293 Students | 1.1 miles away | Not Yet Rated | |
| Woodlawn Elementary Community School PK-6 | 217 Students | 1.1 miles away | Not Yet Rated | |
Compare This School To Nearby Schools ->
School Community Forum

Join a discussion about Tanner Elementary School and talk to others in the community including students, parents, teachers, and administrators.
Popular Discussion Topics
- Admissions and Registration Questions (e.g. Dress Code and Discipline Policy)
- School Calendar and Upcoming Events (e.g. Graduation)
- After School Programs, Extracurricular Activities, and Athletics (e.g. Football)
- News and Announcements (e.g. Yearbook and Class Supply List Details)
- Graduate and Alumni Events (e.g. Organizing Class Reunions)
Navigation
Can't Find What You Are Looking For?
Rankings
Nearby Cities
Sponsored Links
K-12 Articles

Helping Your Learning Disabled Child
Thousands of children in America struggle to learn on a daily basis. Many of them have invisible...
Thousands of children in America struggle to learn on a daily basis. Many of them have invisible...

Bullycide: What is It and How Can It Be Prevented?
Disclaimer: This article expresses my opinion that has been formed by personal experience and...
Disclaimer: This article expresses my opinion that has been formed by personal experience and...

Middle School Homework and Study Habits
The report cards came home and you’re disappointed with your child’s scores. You know he has the...
The report cards came home and you’re disappointed with your child’s scores. You know he has the...