Pulaski Elementary Fine Arts Academy
Rating
Not Available
Not Available

3.5 out of 5 | 2 Reviews
Find Old Friends From Pulaski Elementary Fine Arts Academy
Use the form below to search for alumni from Pulaski Elementary Fine Arts Academy.
School Description
School Summary and Highlights
- Enrolls 806 preschool and elementary school students from grades PK-8
- Ranks 915th out of 1,366 middle schools in IL.
Additional Contact Information
- Mailing Address: 2230 W Mclean Ave, Chicago, IL 60647
- Principal or Admin: Leonor E Karl
School Operational Details
- Title I EligibleAll students of this school are eligible for participation in authorized programs.
School District Details
- Chicago Public Schools
- Per-Pupil Spending: $10,392
- Graduation Rate: 63.8%
- Dropout Rate: 16.3%
- Students Per Teacher: 17.8
- Enrolled Students: 406,068
Faculty Details and Student Enrollment
Students and Faculty
- Total Students Enrolled: 806
- Total Full Time "Equivalent" Teachers: 46.0
- Average Student-To-Teacher Ratio: 17.5
Students Gender Breakdown
- Males: 405 (50.2%)
- Females: 400 (49.6%)
Free Lunch Student Eligibility Breakdown
- Eligible for Reduced Lunch: 93 (11.5%)
- Eligible for Free Lunch: 656 (81.4%)
- Eligible for Either Reduced or Free Lunch: 749 (92.9%)
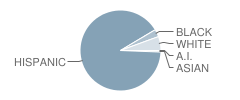
Student Enrollment Distribution by Race / Ethnicity
| Number | Percent | |
|---|---|---|
| American Indian | 1 | 0.1% |
| Black | 24 | 3.0% |
| Asian | 4 | 0.5% |
| Hispanic | 731 | 90.7% |
| White | 45 | 5.6% |
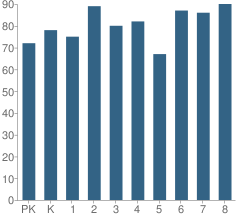
Number of Students Per Grade
| Number | Percent | |
|---|---|---|
| Pre-Kindergarten | 72 | 8.9% |
| Kindergarten | 78 | 9.7% |
| 1st Grade | 75 | 9.3% |
| 2nd Grade | 89 | 11.0% |
| 3rd Grade | 80 | 9.9% |
| 4th Grade | 82 | 10.2% |
| 5th Grade | 67 | 8.3% |
| 6th Grade | 87 | 10.8% |
| 7th Grade | 86 | 10.7% |
| 8th Grade | 90 | 11.2% |
Attendance, Graduation, and Dropout Rates (2010)
Attendance Rate
School:
96.0%
District:
91.5%
State:
93.9%
Source: IL Department of Education, Source: NCES 2009-2010
School Ratings and Reviews
Overall Rating: 3.5

3.5 out of 5 | 2 Reviews
The Overall Rating is the school's average rating from parents, students, school faculty and staff. The highest rating is five apples and the lowest is one apple.
Share Your Review About This School
2 reviews for Pulaski Elementary Fine Arts Academy
- Reviewed by Former Student on June 10, 2008
- Rating:
 (3 / 5) Flag as inappropriate
 - The teachers are great but need to be more strict, one could go outside the classroom and return in 10-20 min and they wont mind. (without their permission). But the students show a lot of knowledge and the school is improving.
- Reviewed by Student on June 11, 2007
- Rating:
 (4 / 5) Flag as inappropriate
 - This school is really involved in the Fine Arts. But we do have some problems from most students. The students also curse but the grades are very high. Most of the students parents have been taught as former students at Pulaski. The kids get along well with student's and teachers.
School Map and Similar Schools Nearby
Click to Activate Map of Nearby School Campuses
Private
Public
This School
Similar Schools Nearby
| Drummond Elementary School PK-8 | 307 Students | 0.5 miles away | Not Yet Rated | |
| Goethe Elementary School PK-8 | 742 Students | 0.6 miles away | Not Yet Rated | |
| Chase Elementary School PK-8 | 497 Students | 0.6 miles away | Not Yet Rated | |
| Moos Elementary School PK-8 | 502 Students | 0.8 miles away | Not Yet Rated | |
| Sabin Elementary Magnet School KG-8 | 598 Students | 0.8 miles away | Not Yet Rated | |
| Pritzker Elementary School PK-8 | 622 Students | 0.8 miles away | Not Yet Rated | |
| Burr Elementary School PK-8 | 321 Students | 0.9 miles away |  4 out of 5 | |
| De Diego Elementary Community Academy PK-8 | 939 Students | 0.9 miles away | Not Yet Rated | |
| Yates Elementary School PK-8 | 761 Students | 0.9 miles away | Not Yet Rated | |
| Von Humboldt Elementary School PK-8 | 528 Students | 0.9 miles away | Not Yet Rated | |
Compare This School To Nearby Schools ->
School Community Forum

Join a discussion about Pulaski Elementary Fine Arts Academy and talk to others in the community including students, parents, teachers, and administrators.
Popular Discussion Topics
- Admissions and Registration Questions (e.g. Dress Code and Discipline Policy)
- School Calendar and Upcoming Events (e.g. Graduation)
- After School Programs, Extracurricular Activities, and Athletics (e.g. Football)
- News and Announcements (e.g. Yearbook and Class Supply List Details)
- Graduate and Alumni Events (e.g. Organizing Class Reunions)
Navigation
Can't Find What You Are Looking For?
Rankings
Sponsored Links
K-12 Articles

Teaching Children with Learning Disabilities to Make Friends
Children with learning disabilities often have trouble making and retaining friendships. Some kids...
Children with learning disabilities often have trouble making and retaining friendships. Some kids...

Helping Your Learning Disabled Child
Thousands of children in America struggle to learn on a daily basis. Many of them have invisible...
Thousands of children in America struggle to learn on a daily basis. Many of them have invisible...

Help Your Child Achieve Success in Middle School
Middle school is for children between the ages of 10 and 14 years. At this time children begin to...
Middle school is for children between the ages of 10 and 14 years. At this time children begin to...