Reed Elementary School
Rating
Not Available
Not Available

No Reviews Yet
Find Old Friends From Reed Elementary School
Use the form below to search for alumni from Reed Elementary School.
School Description
School Summary and Highlights
- Enrolls 218 elementary school students from grades 1-8
- Ranks 1270th out of 1,366 middle schools in IL.
Additional Contact Information
- Mailing Address: 6350 S Stewart Ave, Chicago, IL 60621
- Principal or Admin: Rebecca Watson
School Operational Details
- Title I EligibleAll students of this school are eligible for participation in authorized programs.
School District Details
- Chicago Public Schools
- Per-Pupil Spending: $10,392
- Graduation Rate: 63.8%
- Dropout Rate: 16.3%
- Students Per Teacher: 17.8
- Enrolled Students: 406,068
Faculty Details and Student Enrollment
Students and Faculty
- Total Students Enrolled: 218
- Total Full Time "Equivalent" Teachers: 16.0
- Average Student-To-Teacher Ratio: 13.6
Students Gender Breakdown
- Males: 126 (57.8%)
- Females: 92 (42.2%)
Free Lunch Student Eligibility Breakdown
- Eligible for Reduced Lunch: - (-)
- Eligible for Free Lunch: 214 (98.2%)
- Eligible for Either Reduced or Free Lunch: 214 (98.2%)
Student Enrollment Distribution by Race / Ethnicity
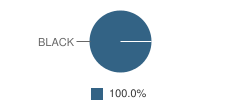
| Number | Percent | |
|---|---|---|
| American Indian | - | - |
| Black | 218 | 100.0% |
| Asian | - | - |
| Hispanic | - | - |
| White | - | - |
Number of Students Per Grade
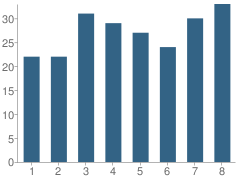
| Number | Percent | |
|---|---|---|
| 1st Grade | 22 | 10.1% |
| 2nd Grade | 22 | 10.1% |
| 3rd Grade | 31 | 14.2% |
| 4th Grade | 29 | 13.3% |
| 5th Grade | 27 | 12.4% |
| 6th Grade | 24 | 11.0% |
| 7th Grade | 30 | 13.8% |
| 8th Grade | 33 | 15.1% |
Attendance, Graduation, and Dropout Rates (2010)
Attendance Rate
School:
90.4%
District:
91.5%
State:
93.9%
Source: IL Department of Education, Source: NCES 2009-2010
School Ratings and Reviews
Be The First To Review Reed Elementary School!
School Map and Similar Schools Nearby
Click to Activate Map of Nearby School Campuses
Private
Public
This School
Similar Schools Nearby
| Kershaw Elementary School PK-8 | 223 Students | 0.3 miles away |  5 out of 5 | |
| Banneker Elementary School PK-8 | 356 Students | 0.4 miles away | Not Yet Rated | |
| Parker Elementary Community Academy PK-8 | 679 Students | 0.7 miles away | Not Yet Rated | |
| Betsy Ross Elementary School PK-8 | 370 Students | 0.7 miles away | Not Yet Rated | |
| Mays Elementary Academy KG-8 | 343 Students | 0.7 miles away | 5 out of 5 | |
| Nicholson Elementary Math & Science School PK-8 | 475 Students | 0.8 miles away | Not Yet Rated | |
| Brownell Elementary School PK-6 | 293 Students | 0.8 miles away | Not Yet Rated | |
| Sherwood Elementary School PK-8 | 408 Students | 0.8 miles away | Not Yet Rated | |
| Yale Elementary School PK-8 | 247 Students | 0.9 miles away | 5 out of 5 | |
| Dulles Elementary School PK-8 | 445 Students | 0.9 miles away | Not Yet Rated | |
Compare This School To Nearby Schools ->
School Community Forum

Join a discussion about Reed Elementary School and talk to others in the community including students, parents, teachers, and administrators.
Popular Discussion Topics
- Admissions and Registration Questions (e.g. Dress Code and Discipline Policy)
- School Calendar and Upcoming Events (e.g. Graduation)
- After School Programs, Extracurricular Activities, and Athletics (e.g. Football)
- News and Announcements (e.g. Yearbook and Class Supply List Details)
- Graduate and Alumni Events (e.g. Organizing Class Reunions)
Navigation
Can't Find What You Are Looking For?
Rankings
Nearby Cities
Sponsored Links
K-12 Articles

Parent and Family Involvement in School
When visiting my grandson’s school, I often hear administrators and teachers complaining that not...
When visiting my grandson’s school, I often hear administrators and teachers complaining that not...

All About Backpacks
Your child riffles through his backpack to find homework assignments, his MP3 player, lunch money...
Your child riffles through his backpack to find homework assignments, his MP3 player, lunch money...

Idle Hands
The worst affliction affecting our kids today is not teen pregnancy, drugs and alcohol, or...
The worst affliction affecting our kids today is not teen pregnancy, drugs and alcohol, or...