Stevenson Elementary School
Rating
Not Available
Not Available

No Reviews Yet
Find Old Friends From Stevenson Elementary School
Use the form below to search for alumni from Stevenson Elementary School.
School Description
School Summary and Highlights
- Enrolls 1,319 preschool and elementary school students from grades PK-8
- Ranks 837th out of 1,366 middle schools in IL.
Additional Contact Information
- Mailing Address: 8010 S Kostner Ave, Chicago, IL 60652
- Principal or Admin: Pam Rice
School Operational Details
- Title I EligibleAll students of this school are eligible for participation in authorized programs.
School District Details
- Chicago Public Schools
- Per-Pupil Spending: $10,392
- Graduation Rate: 63.8%
- Dropout Rate: 16.3%
- Students Per Teacher: 17.8
- Enrolled Students: 406,068
Faculty Details and Student Enrollment
Students and Faculty
- Total Students Enrolled: 1,319
- Total Full Time "Equivalent" Teachers: 67.0
- Average Student-To-Teacher Ratio: 19.7
Students Gender Breakdown
- Males: 680 (51.6%)
- Females: 639 (48.4%)
Free Lunch Student Eligibility Breakdown
- Eligible for Reduced Lunch: 173 (13.1%)
- Eligible for Free Lunch: 1,007 (76.3%)
- Eligible for Either Reduced or Free Lunch: 1,180 (89.5%)
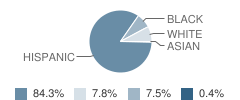
Student Enrollment Distribution by Race / Ethnicity
| Number | Percent | |
|---|---|---|
| American Indian | - | - |
| Black | 99 | 7.5% |
| Asian | 5 | 0.4% |
| Hispanic | 1,112 | 84.3% |
| White | 103 | 7.8% |
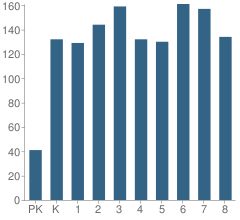
Number of Students Per Grade
| Number | Percent | |
|---|---|---|
| Pre-Kindergarten | 41 | 3.1% |
| Kindergarten | 132 | 10.0% |
| 1st Grade | 129 | 9.8% |
| 2nd Grade | 144 | 10.9% |
| 3rd Grade | 159 | 12.1% |
| 4th Grade | 132 | 10.0% |
| 5th Grade | 130 | 9.9% |
| 6th Grade | 161 | 12.2% |
| 7th Grade | 157 | 11.9% |
| 8th Grade | 134 | 10.2% |
Attendance, Graduation, and Dropout Rates (2010)
Attendance Rate
School:
96.1%
District:
91.5%
State:
93.9%
Teacher Credentials (2010)
Percent of Teachers with Emergency or Provisional Credentials
School:
1.5%
District:
1.2%
State:
0.5%
Source: IL Department of Education, Source: NCES 2009-2010
School Ratings and Reviews
Be The First To Review Stevenson Elementary School!
School Map and Similar Schools Nearby
Click to Activate Map of Nearby School Campuses
Private
Public
This School
Similar Schools Nearby
| Durkin Park Elementary School PK-8 | 534 Students | 0.5 miles away | Not Yet Rated | |
| Dawes Elementary School PK-8 | 1,155 Students | 0.8 miles away | Not Yet Rated | |
| Richard Byrd Elementary School KG-6 | 303 Students | 0.8 miles away | Not Yet Rated | |
| Hometown Elementary School KG-5 | 390 Students | 1.1 miles away | Not Yet Rated | |
| Ashburn Community Elementary School PK-8 | 510 Students | 1.2 miles away | Not Yet Rated | |
| Hampton Elementary Fine & Perf Arts School PK-8 | 722 Students | 1.3 miles away | Not Yet Rated | |
| Owen Elementary Scholastic Academy KG-8 | 247 Students | 1.4 miles away | Not Yet Rated | |
| Luther Burbank Elementary School KG-6 | 524 Students | 1.4 miles away |  5 out of 5 | |
| Hurley Elementary School PK-8 | 1,034 Students | 1.5 miles away | Not Yet Rated | |
| J B Kennedy Elementary School KG-6 | 305 Students | 1.6 miles away | Not Yet Rated | |
Compare This School To Nearby Schools ->
School Community Forum

Join a discussion about Stevenson Elementary School and talk to others in the community including students, parents, teachers, and administrators.
Popular Discussion Topics
- Admissions and Registration Questions (e.g. Dress Code and Discipline Policy)
- School Calendar and Upcoming Events (e.g. Graduation)
- After School Programs, Extracurricular Activities, and Athletics (e.g. Football)
- News and Announcements (e.g. Yearbook and Class Supply List Details)
- Graduate and Alumni Events (e.g. Organizing Class Reunions)
Navigation
Can't Find What You Are Looking For?
Rankings
Nearby Cities
Sponsored Links
K-12 Articles

What to Do when Your Student is Held Back
Kids develop at different speeds, and everyone has different skills and abilities. School is easy...
Kids develop at different speeds, and everyone has different skills and abilities. School is easy...

Middle School Homework and Study Habits
The report cards came home and you're disappointed with your child's scores. You know he has the...
The report cards came home and you're disappointed with your child's scores. You know he has the...

Does Your Child's Teacher Make a Difference
School improvement is always in the news. Teachers demand smaller class sizes. The government calls...
School improvement is always in the news. Teachers demand smaller class sizes. The government calls...