Zapata Elementary Academy
Rating
Not Available
Not Available

No Reviews Yet
Find Old Friends From Zapata Elementary Academy
Use the form below to search for alumni from Zapata Elementary Academy.
School Description
School Summary and Highlights
- Enrolls 981 preschool and elementary school students from grades PK-8
- Ranks 753rd out of 1,366 middle schools in IL.
Additional Contact Information
- Mailing Address: 2728 S Kostner Ave, Chicago, IL 60623
- Principal or Admin: Ruth Fran Garcia
School Operational Details
- Title I EligibleAll students of this school are eligible for participation in authorized programs.
School District Details
- Chicago Public Schools
- Per-Pupil Spending: $10,392
- Graduation Rate: 63.8%
- Dropout Rate: 16.3%
- Students Per Teacher: 17.8
- Enrolled Students: 406,068
Faculty Details and Student Enrollment
Students and Faculty
- Total Students Enrolled: 981
- Total Full Time "Equivalent" Teachers: 50.0
- Average Student-To-Teacher Ratio: 19.6
Students Gender Breakdown
- Males: 500 (51.0%)
- Females: 481 (49.0%)
Free Lunch Student Eligibility Breakdown
- Eligible for Reduced Lunch: 35 (3.6%)
- Eligible for Free Lunch: 943 (96.1%)
- Eligible for Either Reduced or Free Lunch: 978 (99.7%)
Student Enrollment Distribution by Race / Ethnicity
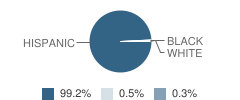
| Number | Percent | |
|---|---|---|
| American Indian | - | - |
| Black | 3 | 0.3% |
| Asian | - | - |
| Hispanic | 973 | 99.2% |
| White | 5 | 0.5% |
Number of Students Per Grade
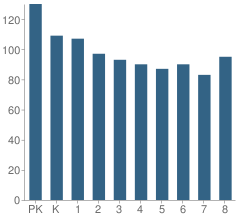
| Number | Percent | |
|---|---|---|
| Pre-Kindergarten | 130 | 13.3% |
| Kindergarten | 109 | 11.1% |
| 1st Grade | 107 | 10.9% |
| 2nd Grade | 97 | 9.9% |
| 3rd Grade | 93 | 9.5% |
| 4th Grade | 90 | 9.2% |
| 5th Grade | 87 | 8.9% |
| 6th Grade | 90 | 9.2% |
| 7th Grade | 83 | 8.5% |
| 8th Grade | 95 | 9.7% |
Attendance, Graduation, and Dropout Rates (2010)
Attendance Rate
School:
96.7%
District:
91.5%
State:
93.9%
Source: IL Department of Education, Source: NCES 2009-2010
School Ratings and Reviews
Be The First To Review Zapata Elementary Academy!
School Map and Similar Schools Nearby
Click to Activate Map of Nearby School Campuses
Private
Public
This School
Similar Schools Nearby
| Corkery Elementary School PK-8 | 666 Students | 0.3 miles away |  5 out of 5 | |
| Whitney Elementary School PK-8 | 1,121 Students | 0.5 miles away | Not Yet Rated | |
| Cicero East Elementary School 4-6 | 888 Students | 0.8 miles away |  1 out of 5 | |
| Woodbine Elementary School PK-3 | 478 Students | 0.9 miles away | Not Yet Rated | |
| Cicero West Elementary School PK-3 | 1,111 Students | 0.9 miles away | Not Yet Rated | |
| Little Village Elementary School PK-8 | 805 Students | 0.9 miles away | 1 out of 5 | |
| Gary Elementary School 3-8 | 1,181 Students | 0.9 miles away | 5 out of 5 | |
| Ortiz De Dominguez Elementary School PK-2 | 776 Students | 0.9 miles away | 5 out of 5 | - |
| Castellanos Elementary School 4-8 | 579 Students | 1.0 miles away | 5 out of 5 | |
| Cardenas Elementary School PK-3 | 613 Students | 1.1 miles away | Not Yet Rated | |
Compare This School To Nearby Schools ->
School Community Forum

Join a discussion about Zapata Elementary Academy and talk to others in the community including students, parents, teachers, and administrators.
Popular Discussion Topics
- Admissions and Registration Questions (e.g. Dress Code and Discipline Policy)
- School Calendar and Upcoming Events (e.g. Graduation)
- After School Programs, Extracurricular Activities, and Athletics (e.g. Football)
- News and Announcements (e.g. Yearbook and Class Supply List Details)
- Graduate and Alumni Events (e.g. Organizing Class Reunions)
Navigation
Can't Find What You Are Looking For?
Rankings
Nearby Cities
Sponsored Links
K-12 Articles

Just a Harmless Vanilla Bean?
Some of the greatest, most used, and most profitable breakthroughs in science have not been made by...
Some of the greatest, most used, and most profitable breakthroughs in science have not been made by...

Helping Your Child Leave the Nest
It's all come down to this: Eighteen years of good times and bad, and now your baby bird is ready...
It's all come down to this: Eighteen years of good times and bad, and now your baby bird is ready...

Summer Reading
In 1998, a book was published in the US that turned a hatred of reading to love. "Harry Potter and...
In 1998, a book was published in the US that turned a hatred of reading to love. "Harry Potter and...