Colemon, J Elementary Academy
Rating
Not Available
Not Available

5 out of 5 | 1 Review
Find Old Friends From Colemon, J Elementary Academy
Use the form below to search for alumni from Colemon, J Elementary Academy.
School Description
School Summary and Highlights
- Enrolls 279 preschool and elementary school students from grades PK-8
- Ranks 835th out of 1,366 middle schools in IL.
Additional Contact Information
- Mailing Address: 1441 W 119th St, Chicago, IL 60643
- Principal or Admin: Henry Thompson
School Operational Details
- Title I EligibleAll students of this school are eligible for participation in authorized programs.
School District Details
- Chicago Public Schools
- Per-Pupil Spending: $10,392
- Graduation Rate: 63.8%
- Dropout Rate: 16.3%
- Students Per Teacher: 17.8
- Enrolled Students: 406,068
Faculty Details and Student Enrollment
Students and Faculty
- Total Students Enrolled: 279
- Total Full Time "Equivalent" Teachers: 14.0
- Average Student-To-Teacher Ratio: 19.9
Students Gender Breakdown
- Males: 104 (37.3%)
- Females: 175 (62.7%)
Free Lunch Student Eligibility Breakdown
- Eligible for Reduced Lunch: 52 (18.6%)
- Eligible for Free Lunch: 187 (67.0%)
- Eligible for Either Reduced or Free Lunch: 239 (85.7%)
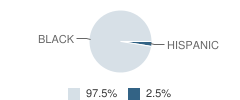
Student Enrollment Distribution by Race / Ethnicity
| Number | Percent | |
|---|---|---|
| American Indian | - | - |
| Black | 272 | 97.5% |
| Asian | - | - |
| Hispanic | 7 | 2.5% |
| White | - | - |
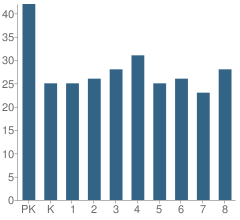
Number of Students Per Grade
| Number | Percent | |
|---|---|---|
| Pre-Kindergarten | 42 | 15.1% |
| Kindergarten | 25 | 9.0% |
| 1st Grade | 25 | 9.0% |
| 2nd Grade | 26 | 9.3% |
| 3rd Grade | 28 | 10.0% |
| 4th Grade | 31 | 11.1% |
| 5th Grade | 25 | 9.0% |
| 6th Grade | 26 | 9.3% |
| 7th Grade | 23 | 8.2% |
| 8th Grade | 28 | 10.0% |
Attendance, Graduation, and Dropout Rates (2010)
Attendance Rate
School:
95.5%
District:
91.5%
State:
93.9%
Source: IL Department of Education, Source: NCES 2009-2010
School Ratings and Reviews
Overall Rating: 5

5 out of 5 | 1 Review
The Overall Rating is the school's average rating from parents, students, school faculty and staff. The highest rating is five apples and the lowest is one apple.
Share Your Review About This School
1 review for Colemon, J Elementary Academy
- Reviewed by Former Student on December 24, 2007
- Rating:
 (5 / 5) Flag as inappropriate
 - i think this school is a great school to send you child to and it has terrific teachers!
School Map and Similar Schools Nearby
Click to Activate Map of Nearby School Campuses
Private
Public
This School
Similar Schools Nearby
| Whistler Elementary School PK-8 | 417 Students | 0.5 miles away | Not Yet Rated | |
| White Elementary Career Academy KG-8 | 169 Students | 0.5 miles away | Not Yet Rated | |
| Higgins Elementary Community Academy PK-8 | 399 Students | 0.6 miles away | Not Yet Rated | |
| Burr Oak Academy PK-2 | 460 Students | 0.6 miles away | Not Yet Rated | - |
| Burr Oak Elementary School 3-5 | 375 Students | 0.8 miles away | Not Yet Rated | |
| Shoop Math-Sciencetech Elementary Academy PK-8 | 676 Students | 0.9 miles away |  1 out of 5 | |
| Esmond Elementary School PK-8 | 397 Students | 0.9 miles away | Not Yet Rated | |
| West Pullman Elementary School PK-8 | 368 Students | 1.1 miles away | Not Yet Rated | |
| Paul Revere Primary School KG-3 | 520 Students | 1.2 miles away | Not Yet Rated | |
| Paul Revere Intermediate School 4-5 | 286 Students | 1.2 miles away | Not Yet Rated | |
Compare This School To Nearby Schools ->
School Community Forum

Join a discussion about Colemon, J Elementary Academy and talk to others in the community including students, parents, teachers, and administrators.
Popular Discussion Topics
- Admissions and Registration Questions (e.g. Dress Code and Discipline Policy)
- School Calendar and Upcoming Events (e.g. Graduation)
- After School Programs, Extracurricular Activities, and Athletics (e.g. Football)
- News and Announcements (e.g. Yearbook and Class Supply List Details)
- Graduate and Alumni Events (e.g. Organizing Class Reunions)
Navigation
Can't Find What You Are Looking For?
Rankings
Nearby Cities
Sponsored Links
K-12 Articles

The First Day of School
The first day of kindergarten is a rite of passage for any student. Every mother cries and...
The first day of kindergarten is a rite of passage for any student. Every mother cries and...

The Cervical Cancer Vaccine
All across North America girls between the ages of 11 and 12 have the opportunity to be vaccinated...
All across North America girls between the ages of 11 and 12 have the opportunity to be vaccinated...

Cutting Class
Depression is a very real problem for today’s youth. When your spirit doesn’t feel good, a lot of...
Depression is a very real problem for today’s youth. When your spirit doesn’t feel good, a lot of...