Hampton Elementary School
Rating
Not Available
Not Available

No Reviews Yet
Find Old Friends From Hampton Elementary School
Use the form below to search for alumni from Hampton Elementary School.
School Description
School Summary and Highlights
- Enrolls 254 elementary school students from grades KG-8
- Ranks 244th out of 1,366 middle schools in IL.
Additional Contact Information
- Principal or Admin: Tom Berg
School Operational Details
- Title I Eligible
School District Details
- Hampton School District 29
- Per-Pupil Spending: $7,174
- Students Per Teacher: 18.6
- Enrolled Students: 254
Faculty Details and Student Enrollment
Students and Faculty
- Total Students Enrolled: 254
- Total Full Time "Equivalent" Teachers: 13.7
- Average Student-To-Teacher Ratio: 18.6
Students Gender Breakdown
- Males: 134 (52.8%)
- Females: 112 (44.1%)
Free Lunch Student Eligibility Breakdown
- Eligible for Reduced Lunch: 10 (3.9%)
- Eligible for Free Lunch: 74 (29.1%)
- Eligible for Either Reduced or Free Lunch: 84 (33.1%)
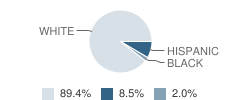
Student Enrollment Distribution by Race / Ethnicity
| Number | Percent | |
|---|---|---|
| American Indian | - | - |
| Black | 5 | 2.0% |
| Asian | - | - |
| Hispanic | 21 | 8.3% |
| White | 220 | 86.6% |
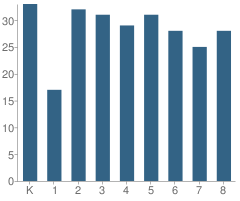
Number of Students Per Grade
| Number | Percent | |
|---|---|---|
| Kindergarten | 33 | 13.0% |
| 1st Grade | 17 | 6.7% |
| 2nd Grade | 32 | 12.6% |
| 3rd Grade | 31 | 12.2% |
| 4th Grade | 29 | 11.4% |
| 5th Grade | 31 | 12.2% |
| 6th Grade | 28 | 11.0% |
| 7th Grade | 25 | 9.8% |
| 8th Grade | 28 | 11.0% |
Attendance, Graduation, and Dropout Rates (2010)
Attendance Rate
School:
96.0%
District:
96.0%
State:
93.9%
Source: IL Department of Education, Source: NCES 2009-2010
School Ratings and Reviews
Be The First To Review Hampton Elementary School!
School Map and Similar Schools Nearby
Click to Activate Map of Nearby School Campuses
Private
Public
This School
Similar Schools Nearby
| Hillcrest Elementary School KG-4 | 340 Students | 3.7 miles away | Not Yet Rated | |
| Ridgewood Elementary School KG-4 | 392 Students | 4.1 miles away |  5 out of 5 | |
| Glenview Middle School 5-8 | 1,024 Students | 4.2 miles away |  2.5 out of 5 | |
| Benjamin Franklin Elementary School KG-6 | 302 Students | 4.5 miles away | 5 out of 5 | |
| Wells Elementary School PK-4 | 450 Students | 5.0 miles away | 5 out of 5 | |
| George Washington Elementary School KG-6 | 296 Students | 5.3 miles away | Not Yet Rated | |
| Roosevelt Elementary School PK-6 | 330 Students | 5.8 miles away | Not Yet Rated | |
| Jane Addams Elementary School KG-6 | 327 Students | 6.1 miles away | 5 out of 5 | |
| Logan Elementary School KG-6 | 475 Students | 6.1 miles away | 5 out of 5 | |
| Colona Grade School PK-8 | 478 Students | 6.3 miles away | Not Yet Rated | |
Compare This School To Nearby Schools ->
School Community Forum

Join a discussion about Hampton Elementary School and talk to others in the community including students, parents, teachers, and administrators.
Popular Discussion Topics
- Admissions and Registration Questions (e.g. Dress Code and Discipline Policy)
- School Calendar and Upcoming Events (e.g. Graduation)
- After School Programs, Extracurricular Activities, and Athletics (e.g. Football)
- News and Announcements (e.g. Yearbook and Class Supply List Details)
- Graduate and Alumni Events (e.g. Organizing Class Reunions)
Navigation
Can't Find What You Are Looking For?
Rankings
Nearby Cities
Sponsored Links
K-12 Articles

Making Sense of No Child Left Behind
The No Child Left Behind Act of 2001 has met with mixed results and mixed feelings. Some think it...
The No Child Left Behind Act of 2001 has met with mixed results and mixed feelings. Some think it...

Nothing New Under the Sun
"I had to go through the same thing when I went to school." Every parent has uttered this phrase,...
"I had to go through the same thing when I went to school." Every parent has uttered this phrase,...

School Violence: Can It Be Stopped
It's a fact that violence in schools is prevalent in today's society. We hear of school shootings,...
It's a fact that violence in schools is prevalent in today's society. We hear of school shootings,...