Frank Borman Middle School
Rating
Not Available
Not Available

No Reviews Yet
Find Old Friends From Frank Borman Middle School
Use the form below to search for alumni from Frank Borman Middle School.
School Description
School Summary and Highlights
- Enrolls 1,119 preschool, elementary, and middle school students from grades PK-8
- Ranks 638th out of 660 middle schools in AZ.
Additional Contact Information
- Mailing Address: 3637 N. 55th Ave., Phoenix, AZ 85033
School Operational Details
- Title I EligibleAll students of this school are eligible for participation in authorized programs.
School District Details
- Cartwright Elementary District
- Per-Pupil Spending: $6,866
- Students Per Teacher: 19.9
- Enrolled Students: 18,351
Faculty Details and Student Enrollment
Students and Faculty
- Total Students Enrolled: 1,119
- Total Full Time "Equivalent" Teachers: 53.0
- Average Student-To-Teacher Ratio: 21.1
Students Gender Breakdown
- Males: 598 (53.4%)
- Females: 521 (46.6%)
Free Lunch Student Eligibility Breakdown
- Eligible for Reduced Lunch: 45 (4.0%)
- Eligible for Free Lunch: 736 (65.8%)
- Eligible for Either Reduced or Free Lunch: 781 (69.8%)
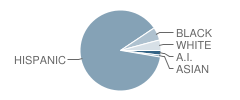
Student Enrollment Distribution by Race / Ethnicity
| Number | Percent | |
|---|---|---|
| American Indian | 21 | 1.9% |
| Black | 58 | 5.2% |
| Asian | 8 | 0.7% |
| Hispanic | 985 | 88.0% |
| White | 47 | 4.2% |
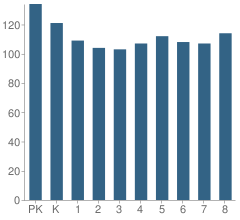
Number of Students Per Grade
| Number | Percent | |
|---|---|---|
| Pre-Kindergarten | 134 | 12.0% |
| Kindergarten | 121 | 10.8% |
| 1st Grade | 109 | 9.7% |
| 2nd Grade | 104 | 9.3% |
| 3rd Grade | 103 | 9.2% |
| 4th Grade | 107 | 9.6% |
| 5th Grade | 112 | 10.0% |
| 6th Grade | 108 | 9.7% |
| 7th Grade | 107 | 9.6% |
| 8th Grade | 114 | 10.2% |
Faculty Educational Background (2006-07)
- Teachers with a Bachelor's Degree: 62%
- Teachers with a Master's Degree or Higher:38%
Faculty Salary and Experience (2006-2007)
- Average Teaching Experience: 7 Years
- Average Salary: $40,267
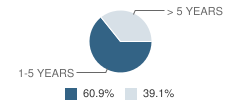
Teacher Experience by Number of Years
| Salary | Percent | |
|---|---|---|
| 1-5 Years of Teaching Experience | $34,535 | 61% |
| More Than 5 Years of Teaching Experience | $49,183 | 39% |
Source: AZ Department of Education, Source: NCES 2009-2010
School Ratings and Reviews
Be The First To Review Frank Borman Middle School!
School Map and Similar Schools Nearby
Click to Activate Map of Nearby School Campuses
Private
Public
This School
Similar Schools Nearby
| Marc T. Atkinson Middle School 6-8 | 1,241 Students | 0.7 miles away | Not Yet Rated | |
| Cartwright School KG-8 | 758 Students | 0.7 miles away | Not Yet Rated | |
| Glenn L. Downs School KG-8 | 691 Students | 0.9 miles away | Not Yet Rated | |
| Andalucia Middle School 4-8 | 1,099 Students | 1.2 miles away | Not Yet Rated | |
| Charles W. Harris School KG-8 | 1,042 Students | 1.2 miles away | Not Yet Rated | |
| Desert Sands Middle School 6-8 | 1,175 Students | 1.5 miles away | Not Yet Rated | |
| Palm Lane School PK-8 | 939 Students | 1.8 miles away | Not Yet Rated | |
| Pueblo Del Sol Middle School 6-8 | 699 Students | 2.0 miles away | Not Yet Rated | |
| Alhambra Traditional School KG-8 | 733 Students | 2.1 miles away | Not Yet Rated | |
| Estrella Middle School 6-8 | 1,269 Students | 2.4 miles away | Not Yet Rated | |
Compare This School To Nearby Schools ->
School Community Forum

Join a discussion about Frank Borman Middle School and talk to others in the community including students, parents, teachers, and administrators.
Popular Discussion Topics
- Admissions and Registration Questions (e.g. Dress Code and Discipline Policy)
- School Calendar and Upcoming Events (e.g. Graduation)
- After School Programs, Extracurricular Activities, and Athletics (e.g. Football)
- News and Announcements (e.g. Yearbook and Class Supply List Details)
- Graduate and Alumni Events (e.g. Organizing Class Reunions)
Navigation
Can't Find What You Are Looking For?
Nearby Cities
Sponsored Links
K-12 Articles

Asperger Syndrome: A Developmental Disorder on the Autism Spectrum
Asperger Syndrome, also known as Pervasive Developmental Disorder is on the high functioning end of...
Asperger Syndrome, also known as Pervasive Developmental Disorder is on the high functioning end of...

Information on Cyberbullying
What is Cyberbullying? Cyberbullying is a new form of harassment, emotional abuse,...
What is Cyberbullying? Cyberbullying is a new form of harassment, emotional abuse,...

Promoting Childhood Literacy
The number of American adults who are illiterate is astounding. People who lack the ability to read...
The number of American adults who are illiterate is astounding. People who lack the ability to read...