Hinckley Elementary School
Rating
Not Available
Not Available

5 out of 5 | 1 Review
Find Old Friends From Hinckley Elementary School
Use the form below to search for alumni from Hinckley Elementary School.
School Description
School Summary and Highlights
- Enrolls 340 preschool and elementary school students from grades PK-5
- Ranks 358th out of 2,453 elementary schools in IL.
Additional Contact Information
- Mailing Address: 600 W Lincoln Hwy, Hinckley, IL 60520
- Principal or Admin: Dennis Owen
School Operational Details
- Title I Eligible
School District Details
- Hinckley Big Rock Community Unit School District - Cusd 429
- Per-Pupil Spending: $10,866
- Graduation Rate: 85.5%
- Students Per Teacher: 14.1
- Enrolled Students: 755
Faculty Details and Student Enrollment
Students and Faculty
- Total Students Enrolled: 340
- Total Full Time "Equivalent" Teachers: 22.8
- Average Student-To-Teacher Ratio: 15.0
Students Gender Breakdown
- Males: 180 (52.9%)
- Females: 140 (41.2%)
Free Lunch Student Eligibility Breakdown
- Eligible for Reduced Lunch: 9 (2.6%)
- Eligible for Free Lunch: 50 (14.7%)
- Eligible for Either Reduced or Free Lunch: 59 (17.4%)
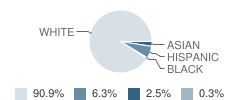
Student Enrollment Distribution by Race / Ethnicity
| Number | Percent | |
|---|---|---|
| American Indian | - | - |
| Black | 1 | 0.3% |
| Asian | 8 | 2.4% |
| Hispanic | 20 | 5.9% |
| White | 291 | 85.6% |
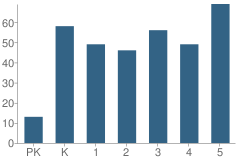
Number of Students Per Grade
| Number | Percent | |
|---|---|---|
| Pre-Kindergarten | 13 | 3.8% |
| Kindergarten | 58 | 17.1% |
| 1st Grade | 49 | 14.4% |
| 2nd Grade | 46 | 13.5% |
| 3rd Grade | 56 | 16.5% |
| 4th Grade | 49 | 14.4% |
| 5th Grade | 69 | 20.3% |
Attendance, Graduation, and Dropout Rates (2010)
Attendance Rate
School:
95.9%
District:
95.3%
State:
93.9%
Source: IL Department of Education, Source: NCES 2009-2010
School Ratings and Reviews
Overall Rating: 5

5 out of 5 | 1 Review
The Overall Rating is the school's average rating from parents, students, school faculty and staff. The highest rating is five apples and the lowest is one apple.
Share Your Review About This School
1 review for Hinckley Elementary School
- Reviewed by Parent/Guardian on August 12, 2009
- Rating:
 (5 / 5) Flag as inappropriate
 - This is a great school filled with great teachers and a wonderful principle
School Map and Similar Schools Nearby
Click to Activate Map of Nearby School Campuses
Private
Public
This School
Similar Schools Nearby
| Big Rock Elementary School 6-8 | 166 Students | 5.3 miles away | Not Yet Rated | |
| Waterman Elementary School KG-5 | 137 Students | 6.3 miles away | Not Yet Rated | |
| Prairie View Elementary School PK-3 | 275 Students | 7.7 miles away | Not Yet Rated | |
| W W Woodbury Elementary School PK-3 | 196 Students | 8.5 miles away | Not Yet Rated | |
| Herman E Dummer School 4-5 | 360 Students | 8.9 miles away | Not Yet Rated | |
| P H Miller Elementary School PK-1 | 492 Students | 8.9 miles away | Not Yet Rated | - |
| Lynn G Haskin Elementary School PK-3 | 272 Students | 9.1 miles away | Not Yet Rated | |
| James R Wood Elementary School PK-4 | 385 Students | 9.5 miles away | Not Yet Rated | |
| Centennial Elementary School 2-3 | 360 Students | 9.7 miles away | Not Yet Rated | |
| Cortland Elementary School PK-5 | 413 Students | 10.6 miles away | Not Yet Rated | |
Compare This School To Nearby Schools ->
School Community Forum

Join a discussion about Hinckley Elementary School and talk to others in the community including students, parents, teachers, and administrators.
Popular Discussion Topics
- Admissions and Registration Questions (e.g. Dress Code and Discipline Policy)
- School Calendar and Upcoming Events (e.g. Graduation)
- After School Programs, Extracurricular Activities, and Athletics (e.g. Football)
- News and Announcements (e.g. Yearbook and Class Supply List Details)
- Graduate and Alumni Events (e.g. Organizing Class Reunions)
Navigation
Can't Find What You Are Looking For?
Rankings
Nearby Cities
Sponsored Links
K-12 Articles

Parent-Teacher Conference Dos and Don'ts
Finals are over and done, and grades have arrived. Now comes the dreaded time to discuss the...
Finals are over and done, and grades have arrived. Now comes the dreaded time to discuss the...

Changing Schools Isn't Easy: Tips for a Successful Transition
It isn’t easy for students to make the transition into a new school, especially if they have...
It isn’t easy for students to make the transition into a new school, especially if they have...

Parent and Family Involvement in School
When visiting my grandson’s school, I often hear administrators and teachers complaining that not...
When visiting my grandson’s school, I often hear administrators and teachers complaining that not...