Mill Street Elementary School
Rating
Not Available
Not Available

No Reviews Yet
Find Old Friends From Mill Street Elementary School
Use the form below to search for alumni from Mill Street Elementary School.
School Description
School Summary and Highlights
- Enrolls 813 elementary school students from grades KG-5
- Ranks 642nd out of 2,453 elementary schools in IL.
Additional Contact Information
- Mailing Address: 1300 N Mill St, Naperville, IL 60563
- Principal or Admin: Mark Demoulin
School Operational Details
- Title I Eligible
School District Details
- Naperville Community Unit School District - Cusd 203
- Per-Pupil Spending: $10,999
- Graduation Rate: 95.7%
- Dropout Rate: 0.7%
- Students Per Teacher: 17.3
- Enrolled Students: 17,944
Faculty Details and Student Enrollment
Students and Faculty
- Total Students Enrolled: 813
- Total Full Time "Equivalent" Teachers: 41.0
- Average Student-To-Teacher Ratio: 19.9
Students Gender Breakdown
- Males: 397 (48.8%)
- Females: 405 (49.8%)
Free Lunch Student Eligibility Breakdown
- Eligible for Reduced Lunch: 16 (2.0%)
- Eligible for Free Lunch: 120 (14.8%)
- Eligible for Either Reduced or Free Lunch: 136 (16.7%)
Student Enrollment Distribution by Race / Ethnicity
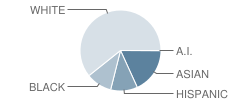
| Number | Percent | |
|---|---|---|
| American Indian | 1 | 0.1% |
| Black | 83 | 10.2% |
| Asian | 145 | 17.8% |
| Hispanic | 86 | 10.6% |
| White | 487 | 59.9% |
Number of Students Per Grade
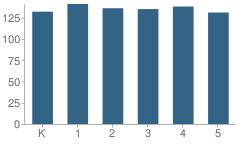
| Number | Percent | |
|---|---|---|
| Kindergarten | 132 | 16.2% |
| 1st Grade | 141 | 17.3% |
| 2nd Grade | 136 | 16.7% |
| 3rd Grade | 135 | 16.6% |
| 4th Grade | 138 | 17.0% |
| 5th Grade | 131 | 16.1% |
Attendance, Graduation, and Dropout Rates (2010)
Attendance Rate
School:
96.2%
District:
96.1%
State:
93.9%
Source: IL Department of Education, Source: NCES 2009-2010
School Ratings and Reviews
Be The First To Review Mill Street Elementary School!
School Map and Similar Schools Nearby
Click to Activate Map of Nearby School Campuses
Private
Public
This School
Similar Schools Nearby
| Beebe Elementary School PK-5 | 795 Students | 0.4 miles away |  5 out of 5 | |
| Naper Elementary School KG-5 | 282 Students | 1.1 miles away | Not Yet Rated | |
| Ellsworth Elementary School KG-5 | 287 Students | 1.2 miles away | 5 out of 5 | |
| Bower Elementary School KG-5 | 481 Students | 1.7 miles away | Not Yet Rated | |
| Highlands Elementary School KG-5 | 595 Students | 1.8 miles away | Not Yet Rated | |
| Brookdale Elementary School KG-5 | 527 Students | 1.8 miles away | Not Yet Rated | |
| Prairie Elementary School KG-5 | 570 Students | 2.1 miles away | Not Yet Rated | |
| Elmwood Elementary School PK-5 | 558 Students | 2.6 miles away | 5 out of 5 | |
| Steeple Run Elementary School KG-5 | 570 Students | 2.6 miles away | Not Yet Rated | |
| May Watts Elementary School KG-5 | 606 Students | 2.7 miles away | Not Yet Rated | |
Compare This School To Nearby Schools ->
School Community Forum

Join a discussion about Mill Street Elementary School and talk to others in the community including students, parents, teachers, and administrators.
Popular Discussion Topics
- Admissions and Registration Questions (e.g. Dress Code and Discipline Policy)
- School Calendar and Upcoming Events (e.g. Graduation)
- After School Programs, Extracurricular Activities, and Athletics (e.g. Football)
- News and Announcements (e.g. Yearbook and Class Supply List Details)
- Graduate and Alumni Events (e.g. Organizing Class Reunions)
Navigation
Can't Find What You Are Looking For?
Rankings
Nearby Cities
Sponsored Links
K-12 Articles

Cell Phones... the Best Thing Since Sliced Bread or the Worst Invention in the World?
Cell phones are wonderful, the best things humans have ever invented! They help us keep in touch...
Cell phones are wonderful, the best things humans have ever invented! They help us keep in touch...

Cutting Class
Depression is a very real problem for today's youth. When your spirit doesn't feel good, a lot of...
Depression is a very real problem for today's youth. When your spirit doesn't feel good, a lot of...

Se Hablan Otras Idiomas?
In the late 1990s, the Salem-Keizer school district in Oregon began requiring every student in its...
In the late 1990s, the Salem-Keizer school district in Oregon began requiring every student in its...