Fulton Elementary School
Rating
Not Available
Not Available

No Reviews Yet
Find Old Friends From Fulton Elementary School
Use the form below to search for alumni from Fulton Elementary School.
School Description
School Summary and Highlights
- Enrolls 434 elementary school students from grades KG-5
- Ranks 1372nd out of 2,453 elementary schools in IL.
Additional Contact Information
- Principal or Admin: Mindy S Dunlap
School Operational Details
- Title I Eligible
School District Details
- River Bend Community Unit District 2
- Per-Pupil Spending: $7,727
- Graduation Rate: 89.4%
- Dropout Rate: 1.5%
- Students Per Teacher: 14.4
- Enrolled Students: 1,015
Faculty Details and Student Enrollment
Students and Faculty
- Total Students Enrolled: 434
- Total Full Time "Equivalent" Teachers: 28.0
- Average Student-To-Teacher Ratio: 15.5
Students Gender Breakdown
- Males: 218 (50.2%)
- Females: 206 (47.5%)
Free Lunch Student Eligibility Breakdown
- Eligible for Reduced Lunch: 47 (10.8%)
- Eligible for Free Lunch: 88 (20.3%)
- Eligible for Either Reduced or Free Lunch: 135 (31.1%)
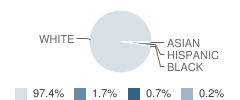
Student Enrollment Distribution by Race / Ethnicity
| Number | Percent | |
|---|---|---|
| American Indian | - | - |
| Black | 1 | 0.2% |
| Asian | 3 | 0.7% |
| Hispanic | 7 | 1.6% |
| White | 413 | 95.2% |
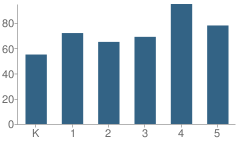
Number of Students Per Grade
| Number | Percent | |
|---|---|---|
| Kindergarten | 55 | 12.7% |
| 1st Grade | 72 | 16.6% |
| 2nd Grade | 65 | 15.0% |
| 3rd Grade | 69 | 15.9% |
| 4th Grade | 95 | 21.9% |
| 5th Grade | 78 | 18.0% |
Attendance, Graduation, and Dropout Rates (2010)
Attendance Rate
School:
95.5%
District:
95.1%
State:
93.9%
Source: IL Department of Education, Source: NCES 2009-2010
School Ratings and Reviews
Be The First To Review Fulton Elementary School!
School Map and Similar Schools Nearby
Click to Activate Map of Nearby School Campuses
Private
Public
This School
Similar Schools Nearby
| West Carroll Intermediate School 4-5 | 193 Students | 6.6 miles away | Not Yet Rated | |
| Northside School PK-2 | 275 Students | 10.5 miles away | Not Yet Rated | - |
| Southside School 3-5 | 242 Students | 10.6 miles away | Not Yet Rated | |
| West Carroll Primary School PK-3 | 463 Students | 14.7 miles away | Not Yet Rated | |
| Erie Elementary School PK-4 | 274 Students | 15.5 miles away |  5 out of 5 | |
| Erie Middle School 5-8 | 207 Students | 15.6 miles away | Not Yet Rated | |
| Chadwick Elementary School 4-5 | 93 Students | 16.9 miles away | Not Yet Rated | |
| Prophetstown Elementary School PK-5 | 314 Students | 17.4 miles away | Not Yet Rated | |
| Riverdale Elementary School PK-5 | 562 Students | 18.6 miles away | Not Yet Rated | |
| Milledgeville Elementary School PK-3 | 194 Students | 20.7 miles away | Not Yet Rated | |
Compare This School To Nearby Schools ->
School Community Forum

Join a discussion about Fulton Elementary School and talk to others in the community including students, parents, teachers, and administrators.
Popular Discussion Topics
- Admissions and Registration Questions (e.g. Dress Code and Discipline Policy)
- School Calendar and Upcoming Events (e.g. Graduation)
- After School Programs, Extracurricular Activities, and Athletics (e.g. Football)
- News and Announcements (e.g. Yearbook and Class Supply List Details)
- Graduate and Alumni Events (e.g. Organizing Class Reunions)
Navigation
Can't Find What You Are Looking For?
Rankings
Nearby Cities
Sponsored Links
K-12 Articles

Middle School Homework and Study Habits
The report cards came home and you're disappointed with your child's scores. You know he has the...
The report cards came home and you're disappointed with your child's scores. You know he has the...

Cutting Class
Depression is a very real problem for today's youth. When your spirit doesn't feel good, a lot of...
Depression is a very real problem for today's youth. When your spirit doesn't feel good, a lot of...

Democracy in Action
There is still over a year until the general election, but the election cycle has been in full...
There is still over a year until the general election, but the election cycle has been in full...