Surprise Elementary School
Rating
Not Available
Not Available

5 out of 5 | 1 Review
Find Old Friends From Surprise Elementary School
Use the form below to search for alumni from Surprise Elementary School.
School Description
School Summary and Highlights
- Enrolls 848 preschool and elementary school students from grades PK-8
- Ranks 358th out of 660 middle schools in AZ.
Additional Contact Information
- Mailing Address: 12907 W. Greenway Rd., El Mirage, AZ 85335
School Operational Details
- Title I EligibleAll students of this school are eligible for participation in authorized programs.
School District Details
- Dysart Unified District
- Per-Pupil Spending: $6,971
- Graduation Rate: 95.0%
- Dropout Rate: 3.3%
- Students Per Teacher: 19.7
- Enrolled Students: 24,359
Faculty Details and Student Enrollment
Students and Faculty
- Total Students Enrolled: 848
- Total Full Time "Equivalent" Teachers: 50.0
- Average Student-To-Teacher Ratio: 17.0
Students Gender Breakdown
- Males: 437 (51.5%)
- Females: 411 (48.5%)
Free Lunch Student Eligibility Breakdown
- Eligible for Reduced Lunch: 82 (9.7%)
- Eligible for Free Lunch: 533 (62.9%)
- Eligible for Either Reduced or Free Lunch: 615 (72.5%)
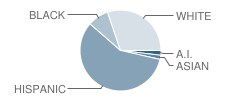
Student Enrollment Distribution by Race / Ethnicity
| Number | Percent | |
|---|---|---|
| American Indian | 16 | 1.9% |
| Black | 71 | 8.4% |
| Asian | 14 | 1.7% |
| Hispanic | 491 | 57.9% |
| White | 256 | 30.2% |
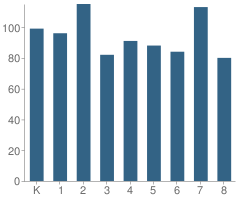
Number of Students Per Grade
| Number | Percent | |
|---|---|---|
| Kindergarten | 99 | 11.7% |
| 1st Grade | 96 | 11.3% |
| 2nd Grade | 115 | 13.6% |
| 3rd Grade | 82 | 9.7% |
| 4th Grade | 91 | 10.7% |
| 5th Grade | 88 | 10.4% |
| 6th Grade | 84 | 9.9% |
| 7th Grade | 113 | 13.3% |
| 8th Grade | 80 | 9.4% |
Faculty Educational Background (2006-07)
- Teachers with a Bachelor's Degree: 82%
- Teachers with a Master's Degree or Higher:18%
Faculty Salary and Experience (2006-2007)
- Average Teaching Experience: 7 Years
- Average Salary: $45,262
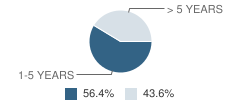
Teacher Experience by Number of Years
| Salary | Percent | |
|---|---|---|
| 1-5 Years of Teaching Experience | $40,306 | 56% |
| More Than 5 Years of Teaching Experience | $51,665 | 44% |
Source: AZ Department of Education, Source: NCES 2009-2010
School Ratings and Reviews
Overall Rating: 5

5 out of 5 | 1 Review
The Overall Rating is the school's average rating from parents, students, school faculty and staff. The highest rating is five apples and the lowest is one apple.
Share Your Review About This School
1 review for Surprise Elementary School
- Reviewed by Former Student on December 07, 2007
- Rating:
 (5 / 5) Flag as inappropriate
 - Surprise Elementary was a great school when i went there and still is. When i drove past the school for the first time in three years i was shocked to see a new building. i miss the old structure but a new one was nice to see.
School Map and Similar Schools Nearby
Click to Activate Map of Nearby School Campuses
Private
Public
This School
Similar Schools Nearby
| West Point Elementary School KG-8 | 939 Students | 1.0 miles away |  1 out of 5 | |
| El Mirage School PK-8 | 942 Students | 1.4 miles away | Not Yet Rated | |
| Thompson Ranch Elementary School KG-8 | 828 Students | 1.6 miles away | Not Yet Rated | |
| Riverview School KG-8 | 1,011 Students | 2.2 miles away | Not Yet Rated | |
| Dysart Elementary School KG-8 | 870 Students | 2.5 miles away | Not Yet Rated | |
| Parkview Elementary School KG-8 | 833 Students | 2.6 miles away | Not Yet Rated | |
| Countryside Elementary School KG-8 | 928 Students | 2.7 miles away |  3.5 out of 5 | |
| Ashton Ranch Elementary School KG-8 | 1,052 Students | 2.8 miles away |  5 out of 5 | |
| Marley Park Elementary School KG-8 | 805 Students | 2.9 miles away | Not Yet Rated | |
| Kingswood Elementary School PK-8 | 753 Students | 3.1 miles away | 5 out of 5 | |
Compare This School To Nearby Schools ->
School Community Forum

Join a discussion about Surprise Elementary School and talk to others in the community including students, parents, teachers, and administrators.
Popular Discussion Topics
- Admissions and Registration Questions (e.g. Dress Code and Discipline Policy)
- School Calendar and Upcoming Events (e.g. Graduation)
- After School Programs, Extracurricular Activities, and Athletics (e.g. Football)
- News and Announcements (e.g. Yearbook and Class Supply List Details)
- Graduate and Alumni Events (e.g. Organizing Class Reunions)
Navigation
Can't Find What You Are Looking For?
Nearby Cities
Sponsored Links
K-12 Articles

The Importance of Reading for Children Preschool to Grade Three
The first teachers of children are their parents. From the time they are infants, children need to...
The first teachers of children are their parents. From the time they are infants, children need to...

Helping Your Child Leave the Nest
It’s all come down to this: Eighteen years of good times and bad, and now your baby bird is ready...
It’s all come down to this: Eighteen years of good times and bad, and now your baby bird is ready...

Preparing Your Child for the First Day of School
It seems like school was just dismissed for the summer, yet here we are facing another year of back...
It seems like school was just dismissed for the summer, yet here we are facing another year of back...