Steward Elementary School
Rating
Not Available
Not Available

No Reviews Yet
Find Old Friends From Steward Elementary School
Use the form below to search for alumni from Steward Elementary School.
School Description
School Summary and Highlights
- Enrolls 81 elementary school students from grades KG-8
- Ranks 323rd out of 1,366 middle schools in IL.
Additional Contact Information
- Principal or Admin: Lanning Nicoloff
School District Details
- Steward Elementary School District 220
- Per-Pupil Spending: $12,089
- Students Per Teacher: 8.4
- Enrolled Students: 81
Faculty Details and Student Enrollment
Students and Faculty
- Total Students Enrolled: 81
- Total Full Time "Equivalent" Teachers: 9.7
- Average Student-To-Teacher Ratio: 8.4
Students Gender Breakdown
- Males: 39 (48.1%)
- Females: 34 (42.0%)
Free Lunch Student Eligibility Breakdown
- Eligible for Reduced Lunch: - (-)
- Eligible for Free Lunch: 28 (34.6%)
- Eligible for Either Reduced or Free Lunch: 28 (34.6%)
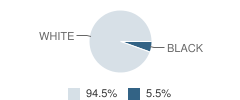
Student Enrollment Distribution by Race / Ethnicity
| Number | Percent | |
|---|---|---|
| American Indian | - | - |
| Black | 4 | 4.9% |
| Asian | - | - |
| Hispanic | - | - |
| White | 69 | 85.2% |
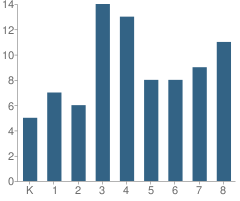
Number of Students Per Grade
| Number | Percent | |
|---|---|---|
| Kindergarten | 5 | 6.2% |
| 1st Grade | 7 | 8.6% |
| 2nd Grade | 6 | 7.4% |
| 3rd Grade | 14 | 17.3% |
| 4th Grade | 13 | 16.0% |
| 5th Grade | 8 | 9.9% |
| 6th Grade | 8 | 9.9% |
| 7th Grade | 9 | 11.1% |
| 8th Grade | 11 | 13.6% |
Attendance, Graduation, and Dropout Rates (2010)
Attendance Rate
School:
95.6%
District:
95.6%
State:
93.9%
Source: IL Department of Education, Source: NCES 2009-2010
School Ratings and Reviews
Be The First To Review Steward Elementary School!
School Map and Similar Schools Nearby
Click to Activate Map of Nearby School Campuses
Private
Public
This School
Similar Schools Nearby
| Creston Elementary School KG-8 | 127 Students | 6.3 miles away |  1 out of 5 | |
| Shabbona Elementary School PK-5 | 238 Students | 9.5 miles away | Not Yet Rated | |
| Malta Elementary School KG-5 | 272 Students | 10.2 miles away | Not Yet Rated | |
| Paul T Wright Elementary School KG-5 | 278 Students | 10.9 miles away | Not Yet Rated | |
| Waterman Elementary School KG-5 | 137 Students | 14.0 miles away | Not Yet Rated | |
| Tyler Elementary School PK-5 | 269 Students | 14.2 miles away | Not Yet Rated | |
| Lincoln Elementary School KG-5 | 286 Students | 14.6 miles away | Not Yet Rated | |
| Chesebro Elementary School KG-5 | 267 Students | 15.2 miles away | Not Yet Rated | |
| Jefferson Elementary School PK-5 | 351 Students | 15.7 miles away | Not Yet Rated | |
| Littlejohn Elementary School PK-5 | 480 Students | 15.9 miles away | Not Yet Rated | |
Compare This School To Nearby Schools ->
Navigation
Can't Find What You Are Looking For?
Rankings
Nearby Cities
Sponsored Links
K-12 Articles

Just a Harmless Vanilla Bean?
Some of the greatest, most used, and most profitable breakthroughs in science have not been made by...
Some of the greatest, most used, and most profitable breakthroughs in science have not been made by...

Attend Your Teen's Holiday Parties
Christmas and New Years are coming, and with them Christmas and New Years Eve parties. At many of...
Christmas and New Years are coming, and with them Christmas and New Years Eve parties. At many of...

Idle Hands
The worst affliction affecting our kids today is not teen pregnancy, drugs and alcohol, or...
The worst affliction affecting our kids today is not teen pregnancy, drugs and alcohol, or...