Apollo High School
Rating
Not Available
Not Available

No Reviews Yet
Find Old Friends From Apollo High School
Use the form below to search for alumni from Apollo High School.
School Description
School Summary and Highlights
- Enrolls 1,856 high school students from grades 9-12
- Ranks 97th out of 385 high schools in AZ.
Additional Contact Information
- Mailing Address: 8045 N. 47th Avenue, Glendale, AZ 85302
School Operational Details
- Title I EligibleAll students of this school are eligible for participation in authorized programs.
School District Details
- Glendale Union High School District
- Per-Pupil Spending: $7,929
- Dropout Rate: 1.5%
- Students Per Teacher: 21.4
- Enrolled Students: 14,920
Faculty Details and Student Enrollment
Students and Faculty
- Total Students Enrolled: 1,856
- Total Full Time "Equivalent" Teachers: 83.2
- Average Student-To-Teacher Ratio: 22.3
Students Gender Breakdown
- Males: 1,000 (53.9%)
- Females: 856 (46.1%)
Free Lunch Student Eligibility Breakdown
- Eligible for Reduced Lunch: 154 (8.3%)
- Eligible for Free Lunch: 815 (43.9%)
- Eligible for Either Reduced or Free Lunch: 969 (52.2%)
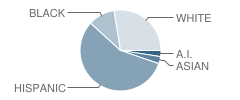
Student Enrollment Distribution by Race / Ethnicity
| Number | Percent | |
|---|---|---|
| American Indian | 45 | 2.4% |
| Black | 198 | 10.7% |
| Asian | 53 | 2.9% |
| Hispanic | 1,049 | 56.5% |
| White | 511 | 27.5% |
Number of Students Per Grade

| Number | Percent | |
|---|---|---|
| 9th Grade | 522 | 28.1% |
| 10th Grade | 500 | 26.9% |
| 11th Grade | 411 | 22.1% |
| 12th Grade | 423 | 22.8% |
Faculty Educational Background (2006-07)
- Teachers with a Bachelor's Degree: 64%
- Teachers with a Master's Degree or Higher:36%
Faculty Salary and Experience (2006-2007)
- Average Teaching Experience: 12 Years
- Average Salary: $50,296
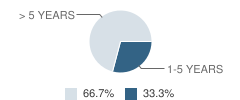
Teacher Experience by Number of Years
| Salary | Percent | |
|---|---|---|
| 1-5 Years of Teaching Experience | $38,449 | 33% |
| More Than 5 Years of Teaching Experience | $56,220 | 67% |
Source: AZ Department of Education, Source: NCES 2009-2010
School Ratings and Reviews
Be The First To Review Apollo High School!
School Map and Similar Schools Nearby
Click to Activate Map of Nearby School Campuses
Private
Public
This School
Similar Schools Nearby
| Cortez High School 9-12 | 1,271 Students | 2.2 miles away | Not Yet Rated | |
| Moon Valley High School 9-12 | 1,598 Students | 3.1 miles away | Not Yet Rated | |
| Alhambra High School 9-12 | 2,916 Students | 3.2 miles away |  5 out of 5 | |
| Washington High School 9-12 | 1,691 Students | 3.3 miles away | Not Yet Rated | |
| Peoria Ecampus School KG-12 | 9 Students | 3.4 miles away | Not Yet Rated | - |
| Ironwood High School 9-12 | 2,050 Students | 3.7 miles away | 5 out of 5 | |
| Independence High School 9-12 | 1,863 Students | 3.8 miles away | Not Yet Rated | |
| Maryvale High School 9-12 | 2,606 Students | 4.8 miles away | Not Yet Rated | |
| Sunnyslope High School 9-12 | 1,791 Students | 4.9 miles away | Not Yet Rated | |
| Peoria High School 9-12 | 1,687 Students | 5.1 miles away | Not Yet Rated | |
Compare This School To Nearby Schools ->
School Community Forum

Join a discussion about Apollo High School and talk to others in the community including students, parents, teachers, and administrators.
Popular Discussion Topics
- Admissions and Registration Questions (e.g. Dress Code and Discipline Policy)
- School Calendar and Upcoming Events (e.g. Graduation)
- After School Programs, Extracurricular Activities, and Athletics (e.g. Football)
- News and Announcements (e.g. Yearbook and Class Supply List Details)
- Graduate and Alumni Events (e.g. Organizing Class Reunions)
Navigation
Can't Find What You Are Looking For?
Sponsored Links
K-12 Articles

Your Child and School Corporal Punishment
Your child comes home at the end of the school day with a huge bruise on his upper arm. When you...
Your child comes home at the end of the school day with a huge bruise on his upper arm. When you...

What to Do when Your Student is Held Back
Kids develop at different speeds, and everyone has different skills and abilities. School is easy...
Kids develop at different speeds, and everyone has different skills and abilities. School is easy...

All About Backpacks
Your child riffles through his backpack to find homework assignments, his MP3 player, lunch money...
Your child riffles through his backpack to find homework assignments, his MP3 player, lunch money...