Instructional Services Center-Options Alternative Program School
Rating
Not Available
Not Available

No Reviews Yet
Find Old Friends From Instructional Services Center-Options Alternative Program School
Use the form below to search for alumni from Instructional Services Center-Options Alternative Program School.
School Description
School Summary and Highlights
- Enrolls 68 middle and high school students from grades 6-12
Additional Contact Information
- Principal or Admin: Green Gary
- Fax: (812) 288-4829
School Operational Details
- Alternative School
School District Details
- Greater Clark County Schools District
- Per-Pupil Spending: $9,066
- Graduation Rate: 66.3%
- Dropout Rate: 3.4%
- Students Per Teacher: 17.2
- Enrolled Students: 10,970
Faculty Details and Student Enrollment
Students and Faculty
- Total Students Enrolled: 68
- Total Full Time "Equivalent" Teachers: 4.0
- Average Student-To-Teacher Ratio: 17.0
Students Gender Breakdown
- Males: 33 (48.5%)
- Females: 28 (41.2%)
Free Lunch Student Eligibility Breakdown
- Eligible for Reduced Lunch: 2 (2.9%)
- Eligible for Free Lunch: 19 (27.9%)
- Eligible for Either Reduced or Free Lunch: 21 (30.9%)
Student Enrollment Distribution by Race / Ethnicity
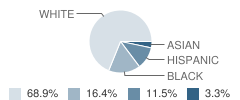
| Number | Percent | |
|---|---|---|
| American Indian | - | - |
| Black | 10 | 14.7% |
| Asian | 2 | 2.9% |
| Hispanic | 7 | 10.3% |
| White | 42 | 61.8% |
Number of Students Per Grade

| Number | Percent | |
|---|---|---|
| 6th Grade | 2 | 2.9% |
| 7th Grade | 4 | 5.9% |
| 8th Grade | 6 | 8.8% |
| 9th Grade | 2 | 2.9% |
| 10th Grade | 13 | 19.1% |
| 11th Grade | 9 | 13.2% |
| 12th Grade | 32 | 47.1% |
Source: IN Department of Education, Source: NCES 2009-2010
School Ratings and Reviews
Be The First To Review Instructional Services Center-Options Alternative Program School!
Navigation
Can't Find What You Are Looking For?
Nearby Cities
Sponsored Links
K-12 Articles

How to Get the Best Supplies for Your Money
School supply lists can seem unending, and the price can add up very quickly. But do we really...
School supply lists can seem unending, and the price can add up very quickly. But do we really...

Cell Phones... the Best Thing Since Sliced Bread or the Worst Invention in the World?
Cell phones are wonderful, the best things humans have ever invented! They help us keep in touch...
Cell phones are wonderful, the best things humans have ever invented! They help us keep in touch...

Keep Morning Stress at a Minimum: Establish a Routine
Morning! It can be a time of stress. The kids are fighting over who gets to use the bathroom first,...
Morning! It can be a time of stress. The kids are fighting over who gets to use the bathroom first,...