Sycamore Ridge School
5333 Old Carmel Valley Rd, San Diego, CA 92130 | (858) 755-1060
- Grades: KG-6
- Student Enrollment: 394
Rating
Not Available
Not Available

No Reviews Yet
Find Old Friends From Sycamore Ridge School
Use the form below to search for alumni from Sycamore Ridge School.
School Description
School Summary and Highlights
- Enrolls 394 elementary school students from grades KG-6
- Ranks 115th out of 5,423 elementary schools in CA.
- 2010 Overall School AYP Met Status: Yes
Additional Contact Information
- Mailing Address: 5333 Old Carmel Valley Rd., San Diego, CA 92130
School District Details
- Del Mar Union Elementary School District
- Per-Pupil Spending: $10,284
- Students Per Teacher: 17.4
- Enrolled Students: 4,169
Faculty Details and Student Enrollment
Students and Faculty
- Total Students Enrolled: 394
- Total Full Time "Equivalent" Teachers: 23.4
- Average Student-To-Teacher Ratio: 16.8
Students Gender Breakdown
- Males: 206 (52.3%)
- Females: 188 (47.7%)
Free Lunch Student Eligibility Breakdown
- Eligible for Reduced Lunch: 16 (4.1%)
- Eligible for Free Lunch: 41 (10.4%)
- Eligible for Either Reduced or Free Lunch: 57 (14.5%)
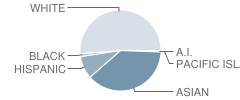
Student Enrollment Distribution by Race / Ethnicity
| Number | Percent | |
|---|---|---|
| American Indian | 2 | 0.5% |
| Black | 5 | 1.3% |
| Asian | 146 | 37.1% |
| Hispanic | 35 | 8.9% |
| White | 197 | 50.0% |
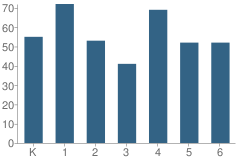
Number of Students Per Grade
| Number | Percent | |
|---|---|---|
| Kindergarten | 55 | 14.0% |
| 1st Grade | 72 | 18.3% |
| 2nd Grade | 53 | 13.5% |
| 3rd Grade | 41 | 10.4% |
| 4th Grade | 69 | 17.5% |
| 5th Grade | 52 | 13.2% |
| 6th Grade | 52 | 13.2% |
Teacher Education Background (2009)
Percent With Ph.D.
School:
6.9%
District:
6.3%
Percent With Master's Degree
School:
31.0%
District:
31.3%
Percent With Bachelor's Degree
School:
3.4%
District:
12.5%
Teacher Credentials & Experience (2009)
Percent of Teachers With Credentials: 100.0%
Number of Certificated Staff: 29.0
Average Number of Years of Teacher Experience: 9.0
Average Age
School:
36.3
District:
48.1
Source: CA Department of Education, Source: NCES 2009-2010
School Ratings and Reviews
Be The First To Review Sycamore Ridge School!
School Map and Similar Schools Nearby
Click to Activate Map of Nearby School Campuses
Private
Public
This School
Similar Schools Nearby
| Ashley Falls Elementary School KG-6 | 470 Students | 0.6 miles away | Not Yet Rated | |
| Carmel Creek Elementary School KG-4 | 526 Students | 1.5 miles away | Not Yet Rated | |
| Solana Pacific Elementary School 5-6 | 489 Students | 1.8 miles away | Not Yet Rated | |
| Carmel Del Mar Elementary School KG-6 | 438 Students | 1.9 miles away | Not Yet Rated | |
| Sage Canyon School KG-6 | 760 Students | 1.9 miles away | Not Yet Rated | |
| Ocean Air School KG-6 | 674 Students | 2.0 miles away | Not Yet Rated | - |
| Solana Highlands Elementary School KG-4 | 528 Students | 2.3 miles away | Not Yet Rated | |
| Del Mar Hills Elementary School KG-6 | 329 Students | 2.7 miles away | Not Yet Rated | |
| Del Mar Heights Elementary School KG-6 | 445 Students | 2.9 miles away | Not Yet Rated | |
| Park Village Elementary School KG-5 | 722 Students | 3.0 miles away | Not Yet Rated | |
Compare This School To Nearby Schools ->
School Community Forum

Join a discussion about Sycamore Ridge School and talk to others in the community including students, parents, teachers, and administrators.
Popular Discussion Topics
- Admissions and Registration Questions (e.g. Dress Code and Discipline Policy)
- School Calendar and Upcoming Events (e.g. Graduation)
- After School Programs, Extracurricular Activities, and Athletics (e.g. Football)
- News and Announcements (e.g. Yearbook and Class Supply List Details)
- Graduate and Alumni Events (e.g. Organizing Class Reunions)
Navigation
Can't Find What You Are Looking For?
Rankings
Nearby Cities
Sponsored Links
K-12 Articles

Tips for Purchasing Back to School Supplies
In just a few days, kids from all over the US will be going back to school. Now is the time to take...
In just a few days, kids from all over the US will be going back to school. Now is the time to take...

Help Your High School Student Create an Impressive Resume
Time has flown. Your teen is in high school and has demonstrated an interest in obtaining a part...
Time has flown. Your teen is in high school and has demonstrated an interest in obtaining a part...

Cut the Credit and Save You Some Money
Today’s society glorifies a get-it-now mentality. Children learn this early. You probably noticed...
Today’s society glorifies a get-it-now mentality. Children learn this early. You probably noticed...