Penryn Elementary School
Rating
Not Available
Not Available

No Reviews Yet
Find Old Friends From Penryn Elementary School
Use the form below to search for alumni from Penryn Elementary School.
School Description
School Summary and Highlights
- Enrolls 231 elementary school students from grades KG-8
- Ranks 594th out of 2,050 middle schools in CA.
- 2010 Overall School AYP Met Status: Yes
School District Details
- Loomis Union Elementary School District
- Per-Pupil Spending: $7,566
- Students Per Teacher: 22.0
- Enrolled Students: 2,505
Faculty Details and Student Enrollment
Students and Faculty
- Total Students Enrolled: 231
- Total Full Time "Equivalent" Teachers: 11.5
- Average Student-To-Teacher Ratio: 20.1
Students Gender Breakdown
- Males: 119 (51.5%)
- Females: 112 (48.5%)
Free Lunch Student Eligibility Breakdown
- Eligible for Reduced Lunch: 11 (4.8%)
- Eligible for Free Lunch: 39 (16.9%)
- Eligible for Either Reduced or Free Lunch: 50 (21.6%)
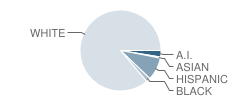
Student Enrollment Distribution by Race / Ethnicity
| Number | Percent | |
|---|---|---|
| American Indian | 6 | 2.6% |
| Black | 4 | 1.7% |
| Asian | 1 | 0.4% |
| Hispanic | 21 | 9.1% |
| White | 199 | 86.1% |
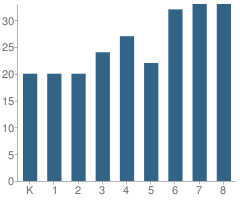
Number of Students Per Grade
| Number | Percent | |
|---|---|---|
| Kindergarten | 20 | 8.7% |
| 1st Grade | 20 | 8.7% |
| 2nd Grade | 20 | 8.7% |
| 3rd Grade | 24 | 10.4% |
| 4th Grade | 27 | 11.7% |
| 5th Grade | 22 | 9.5% |
| 6th Grade | 32 | 13.9% |
| 7th Grade | 33 | 14.3% |
| 8th Grade | 33 | 14.3% |
Teacher Education Background (2009)
Percent With Master's Degree
School:
7.1%
District:
53.8%
Percent With Bachelor's Degree: 7.1%
Teacher Credentials & Experience (2009)
Percent of Teachers With Credentials: 100.0%
Number of Certificated Staff: 14.0
Average Number of Years of Teacher Experience: 13.1
Average Age
School:
41.3
District:
46.2
Source: CA Department of Education, Source: NCES 2009-2010
School Ratings and Reviews
Be The First To Review Penryn Elementary School!
School Map and Similar Schools Nearby
Click to Activate Map of Nearby School Campuses
Private
Public
This School
Similar Schools Nearby
| H. Clarke Powers Elementary School KG-8 | 434 Students | 2.2 miles away | Not Yet Rated | |
| Loomis Elementary School KG-8 | 437 Students | 2.2 miles away | Not Yet Rated | |
| Newcastle Elementary School KG-8 | 208 Students | 2.4 miles away | Not Yet Rated | |
| Placer Elementary School KG-8 | 445 Students | 3.7 miles away | Not Yet Rated | |
| Ophir Elementary School KG-8 | 216 Students | 3.9 miles away | Not Yet Rated | |
| Valley View Elementary School KG-6 | 675 Students | 4.5 miles away |  1 out of 5 | |
| Franklin Elementary School KG-8 | 482 Students | 4.7 miles away | Not Yet Rated | |
| Twelve Bridges Elementary School KG-5 | 709 Students | 5.0 miles away | Not Yet Rated | |
| Breen Elementary School KG-6 | 672 Students | 5.2 miles away |  4.5 out of 5 | |
| Rocklin Elementary School KG-6 | 528 Students | 5.2 miles away | Not Yet Rated | |
Compare This School To Nearby Schools ->
School Community Forum

Join a discussion about Penryn Elementary School and talk to others in the community including students, parents, teachers, and administrators.
Popular Discussion Topics
- Admissions and Registration Questions (e.g. Dress Code and Discipline Policy)
- School Calendar and Upcoming Events (e.g. Graduation)
- After School Programs, Extracurricular Activities, and Athletics (e.g. Football)
- News and Announcements (e.g. Yearbook and Class Supply List Details)
- Graduate and Alumni Events (e.g. Organizing Class Reunions)
Navigation
Can't Find What You Are Looking For?
Rankings
Nearby Cities
Sponsored Links
K-12 Articles

Keeping Our Kids Safe in the Post 9/11 World
Recently, radio talk show host and CNN personality did a week-long special entitled "The Perfect...
Recently, radio talk show host and CNN personality did a week-long special entitled "The Perfect...

School Violence: Can It Be Stopped
It's a fact that violence in schools is prevalent in today's society. We hear of school shootings,...
It's a fact that violence in schools is prevalent in today's society. We hear of school shootings,...

When Bad Report Cards Happen to Good Kids
It's mid-term season once again, and semester (or quarter or trimester) grades will be coming out...
It's mid-term season once again, and semester (or quarter or trimester) grades will be coming out...