California Virtual Academy @ Sutter
2360 Shasta Way Unit B, Simi Valley, CA 93065 | (805) 581-0202
- Grades: KG-12
- Student Enrollment: 607

No Reviews Yet
Find Old Friends From California Virtual Academy @ Sutter
Use the form below to search for alumni from California Virtual Academy @ Sutter.
School Description
School Summary and Highlights
- Enrolls 607 elementary, middle, and high school students from grades KG-12
- Ranks 684th out of 1,197 high schools in CA.
- 2010 Overall School AYP Met Status: No
Additional Contact Information
- Mailing Address: 2360 Shasta Way, Unit B, Simi Valley, CA 93065
School Operational Details
- Title I EligibleAll students of this school are eligible for participation in authorized programs.
- Charter School
School District Details
- Nuestro Elementary School District
- Per-Pupil Spending: $7,754
- Students Per Teacher: 23.4
- Enrolled Students: 725
Faculty Details and Student Enrollment
Students and Faculty
- Total Students Enrolled: 607
- Total Full Time "Equivalent" Teachers: 23.4
- Average Student-To-Teacher Ratio: 25.9
Students Gender Breakdown
- Males: 316 (52.1%)
- Females: 291 (47.9%)
Free Lunch Student Eligibility Breakdown
- Eligible for Reduced Lunch: 46 (7.6%)
- Eligible for Free Lunch: 102 (16.8%)
- Eligible for Either Reduced or Free Lunch: 148 (24.4%)
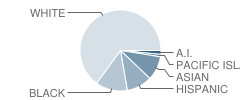
Student Enrollment Distribution by Race / Ethnicity

| Number | Percent | |
|---|---|---|
| American Indian | 10 | 1.6% |
| Black | 67 | 11.0% |
| Asian | 51 | 8.4% |
| Hispanic | 54 | 8.9% |
| White | 333 | 54.9% |
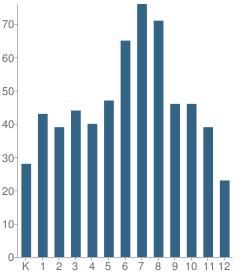
Number of Students Per Grade

| Number | Percent | |
|---|---|---|
| Kindergarten | 28 | 4.6% |
| 1st Grade | 43 | 7.1% |
| 2nd Grade | 39 | 6.4% |
| 3rd Grade | 44 | 7.2% |
| 4th Grade | 40 | 6.6% |
| 5th Grade | 47 | 7.7% |
| 6th Grade | 65 | 10.7% |
| 7th Grade | 76 | 12.5% |
| 8th Grade | 71 | 11.7% |
| 9th Grade | 46 | 7.6% |
| 10th Grade | 46 | 7.6% |
| 11th Grade | 39 | 6.4% |
| 12th Grade | 23 | 3.8% |
Teacher Education Background (2009)
Percent With Ph.D.: 2.1%
Percent With Master's Degree: 24.0%
Percent With Bachelor's Degree: 8.3%
Teacher Credentials & Experience (2009)
Percent of Teachers With Credentials: 98.8%
Number of Certificated Staff: 96.0
Average Number of Years of Teacher Experience: 8.0
Average Age: 34.0
Source: CA Department of Education, Source: NCES 2009-2010
School Ratings and Reviews
Be The First To Review California Virtual Academy @ Sutter!
Sponsored Links
Test Scores and Performance Information
Overall School Rating
How is this determined?
The overall school rating shows that California Virtual Academy @ Sutter performed on average worse than many other schools across the state on CST state exams in the following subjects:
- CST Algebra I
- CST Algebra II
- CST Biology
- CST Chemistry
- CST Earth Science
- CST English-Language Arts
- CST General Mathematics
- CST Geometry
- CST History - Social Science
- CST Mathematics
- CST Science
- CST U.S. History
- CST World History
AYP Results (2010)
Overall AYP Met: No
ELA AYP Met: No
Math AYP Met: No
Program Improvement (PI) Requirement Under NCLB (2010)
First Year PI Requirement was Implemented: 2009-2010
School's Placement Under NCLB: Year 2
SAT Exam Results (2009)
Percent of Students Taking SAT Exam: 20.0%
CST - Test Proficiency by Grade and Subject
Grade 2 - % of students at or above proficiency
| School | District | State | |
|---|---|---|---|
| CST English-Language Arts Test | |||
| 2010 | 48.0% | 54.0% | 53.0% |
| 2009 | 47.0% | 36.0% | 53.0% |
| 2008 | 40.0% | 27.0% | 48.0% |
| CST Mathematics Test | |||
| 2010 | 39.0% | 85.0% | 62.0% |
| 2009 | 44.0% | 76.0% | 63.0% |
| 2008 | 30.0% | 53.0% | 59.0% |
Grade 3 - % of students at or above proficiency
| School | District | State | |
|---|---|---|---|
| CST English-Language Arts Test | |||
| 2010 | 41.0% | 29.0% | 43.0% |
| 2009 | 54.0% | 36.0% | 44.0% |
| 2008 | 39.0% | 41.0% | 38.0% |
| CST Mathematics Test | |||
| 2010 | 28.0% | 65.0% | 65.0% |
| 2009 | 32.0% | 53.0% | 64.0% |
| 2008 | 34.0% | 41.0% | 61.0% |
Grade 4 - % of students at or above proficiency
| School | District | State | |
|---|---|---|---|
| CST English-Language Arts Test | |||
| 2010 | 58.0% | 73.0% | 63.0% |
| 2009 | 77.0% | 81.0% | 61.0% |
| 2008 | 70.0% | 79.0% | 55.0% |
| CST Mathematics Test | |||
| 2010 | 46.0% | 45.0% | 68.0% |
| 2009 | 50.0% | 76.0% | 66.0% |
| 2008 | 18.0% | 58.0% | 61.0% |
Grade 5 - % of students at or above proficiency
| School | District | State | |
|---|---|---|---|
| CST English-Language Arts Test | |||
| 2010 | 54.0% | 63.0% | 58.0% |
| 2009 | 44.0% | 48.0% | 54.0% |
| 2008 | 53.0% | 45.0% | 48.0% |
| CST Mathematics Test | |||
| 2010 | 40.0% | 56.0% | 61.0% |
| 2009 | 19.0% | 47.0% | 57.0% |
| 2008 | 20.0% | 9.0% | 51.0% |
| CST Science Test | |||
| 2010 | 48.0% | 63.0% | 56.0% |
| 2009 | 32.0% | 59.0% | 49.0% |
| 2008 | 44.0% | 54.0% | 46.0% |
Grade 6 - % of students at or above proficiency
| School | District | State | |
|---|---|---|---|
| CST English-Language Arts Test | |||
| 2010 | 55.0% | 69.0% | 55.0% |
| 2009 | 55.0% | 42.0% | 52.0% |
| 2008 | 57.0% | 43.0% | 47.0% |
| CST Mathematics Test | |||
| 2010 | 27.0% | 54.0% | 52.0% |
| 2009 | 36.0% | 8.0% | 49.0% |
| 2008 | 30.0% | 43.0% | 44.0% |
Grade 7 - % of students at or above proficiency
| School | District | State | |
|---|---|---|---|
| CST English-Language Arts Test | |||
| 2010 | 48.0% | - | 55.0% |
| 2009 | 59.0% | 91.0% | 54.0% |
| 2008 | 60.0% | 54.0% | 49.0% |
| CST Mathematics Test | |||
| 2010 | 29.0% | - | 48.0% |
| 2009 | 29.0% | 64.0% | 43.0% |
| 2008 | 46.0% | - | 41.0% |
Grade 8 - % of students at or above proficiency
| School | District | State | |
|---|---|---|---|
| CST Algebra I Test | |||
| 2010 | 15.0% | - | 46.0% |
| CST English-Language Arts Test | |||
| 2010 | 56.0% | 75.0% | 54.0% |
| 2009 | 48.0% | - | 48.0% |
| 2008 | 48.0% | 54.0% | 45.0% |
| CST General Mathematics Test | |||
| 2010 | 37.0% | - | 30.0% |
| 2009 | 29.0% | - | 30.0% |
| 2008 | 31.0% | 38.0% | 31.0% |
| CST History - Social Science Test | |||
| 2010 | 36.0% | 58.0% | 47.0% |
| 2009 | 25.0% | - | 42.0% |
| 2008 | 29.0% | 62.0% | 36.0% |
| CST Science Test | |||
| 2010 | 46.0% | 75.0% | 59.0% |
| 2009 | 39.0% | - | 56.0% |
| 2008 | 25.0% | 38.0% | 52.0% |
Grade 9 - % of students at or above proficiency
| School | District | State | |
|---|---|---|---|
| CST Algebra I Test | |||
| 2010 | 14.0% | - | 22.0% |
| 2009 | 5.0% | - | 21.0% |
| CST Earth Science Test | |||
| 2010 | 42.0% | - | 35.0% |
| 2009 | 17.0% | - | 29.0% |
| CST English-Language Arts Test | |||
| 2010 | 56.0% | - | 54.0% |
| 2009 | 61.0% | - | 50.0% |
| 2008 | 70.0% | - | 49.0% |
| CST World History Test | |||
| 2008 | 50.0% | - | 36.0% |
Grade 10 - % of students at or above proficiency
| School | District | State | |
|---|---|---|---|
| CST Algebra I Test | |||
| 2010 | 8.0% | - | 12.0% |
| CST Biology Test | |||
| 2010 | 27.0% | - | 38.0% |
| 2009 | 33.0% | - | 34.0% |
| CST English-Language Arts Test | |||
| 2010 | 36.0% | - | 45.0% |
| 2009 | 53.0% | - | 44.0% |
| 2008 | 50.0% | - | 41.0% |
| CST Geometry Test | |||
| 2010 | 17.0% | - | 14.0% |
| 2009 | 17.0% | - | 14.0% |
| CST Science Test | |||
| 2010 | 40.0% | - | 46.0% |
| 2009 | 46.0% | - | 44.0% |
| 2008 | 11.0% | - | 40.0% |
| CST World History Test | |||
| 2010 | 29.0% | - | 42.0% |
| 2009 | 34.0% | - | 38.0% |
Grade 11 - % of students at or above proficiency
| School | District | State | |
|---|---|---|---|
| CST Biology Test | |||
| 2010 | 42.0% | - | 46.0% |
| CST Chemistry Test | |||
| 2010 | 15.0% | - | 30.0% |
| CST English-Language Arts Test | |||
| 2010 | 49.0% | - | 42.0% |
| 2009 | 55.0% | - | 40.0% |
| CST Geometry Test | |||
| 2010 | 7.0% | - | 6.0% |
| CST U.S. History Test | |||
| 2010 | 39.0% | - | 45.0% |
| 2009 | 35.0% | - | 44.0% |
End of Course - % of students at or above proficiency
| School | District | State | |
|---|---|---|---|
| CST Algebra I Test | |||
| 2010 | 14.0% | - | 31.0% |
| 2009 | 6.0% | - | 28.0% |
| 2008 | 10.0% | - | 25.0% |
| CST Algebra II Test | |||
| 2010 | 6.0% | - | 31.0% |
| 2009 | 8.0% | - | 28.0% |
| CST Biology Test | |||
| 2010 | 37.0% | - | 46.0% |
| 2009 | 27.0% | - | 42.0% |
| 2008 | 14.0% | - | 42.0% |
| CST Chemistry Test | |||
| 2010 | 20.0% | - | 38.0% |
| CST Earth Science Test | |||
| 2010 | 35.0% | - | 33.0% |
| 2009 | 19.0% | - | 28.0% |
| CST General Mathematics Test | |||
| 2010 | 32.0% | - | 27.0% |
| 2009 | 29.0% | - | 26.0% |
| 2008 | 30.0% | 38.0% | 27.0% |
| CST Geometry Test | |||
| 2010 | 23.0% | - | 27.0% |
| 2009 | 24.0% | - | 26.0% |
| CST World History Test | |||
| 2010 | 33.0% | - | 41.0% |
| 2009 | 33.0% | - | 38.0% |
| 2008 | 23.0% | - | 33.0% |
Source: CA Department of Education 2009-2010
School Map and Similar Schools Nearby
Click to Activate Map of Nearby School Campuses
Private
Public
This School
Similar Schools Nearby
| California Virtual Academy at Los Angeles KG-12 | 4,222 Students | 0 miles away | Not Yet Rated | - |
| Somis Academy KG-12 | 178 Students | 13.6 miles away | Not Yet Rated | |
| Camarillo Academy of Progressive Education KG-12 | 497 Students | 15.9 miles away | Not Yet Rated | - |
| Vista Real Charter High School 9-12 | 696 Students | 23.0 miles away | Not Yet Rated | |
| Golden Valley Virtual Charter School KG-12 | 25 Students | 25.0 miles away | Not Yet Rated | - |
| Valley Oak Charter School KG-10 | 59 Students | 28.7 miles away | ![]() 5 out of 5 | |
Compare This School To Nearby Schools ->
School Community Forum

Join a discussion about California Virtual Academy @ Sutter and talk to others in the community including students, parents, teachers, and administrators.
Popular Discussion Topics
- Admissions and Registration Questions (e.g. Dress Code and Discipline Policy)
- School Calendar and Upcoming Events (e.g. Graduation)
- After School Programs, Extracurricular Activities, and Athletics (e.g. Football)
- News and Announcements (e.g. Yearbook and Class Supply List Details)
- Graduate and Alumni Events (e.g. Organizing Class Reunions)
Navigation
Can't Find What You Are Looking For?
Rankings
Nearby Cities
Sponsored Links
K-12 Articles
Strategies to Help Kids Cope with Stress
Many parents believe that kids don't experience stress. Nothing could be further from the truth....
A Cheat Sheet on Cheating
Senior projects are coming due and finals are coming up. Spring has sprung, and with spring comes...
Teaching Children with Learning Disabilities to Make Friends
Children with learning disabilities often have trouble making and retaining friendships. Some kids...

