P.S. 76 A. Phillip Randolph School
Rating
Not Available
Not Available

No Reviews Yet
Find Old Friends From P.S. 76 A. Phillip Randolph School
Use the form below to search for alumni from P.S. 76 A. Phillip Randolph School.
School Description
School Summary and Highlights
- Enrolls 447 preschool and elementary school students from grades PK-6
- Ranks 2442nd out of 2,535 elementary schools in NY.
- National Blue Ribbon Schools Award 2004

Additional Contact Information
- Mailing Address: 220 W 121st St, New York, NY 10027
- Principal or Admin: Charles Deberry
School Operational Details
- Title I EligibleAll students of this school are eligible for participation in authorized programs.
Faculty Details and Student Enrollment
Students and Faculty
- Total Students Enrolled: 447
- Total Full Time "Equivalent" Teachers: 32.0
- Average Student-To-Teacher Ratio: 14.0
Students Gender Breakdown
- Males: 230 (51.5%)
- Females: 217 (48.5%)
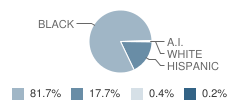
Student Enrollment Distribution by Race / Ethnicity
| Number | Percent | |
|---|---|---|
| American Indian | 1 | 0.2% |
| Black | 365 | 81.7% |
| Asian | - | - |
| Hispanic | 79 | 17.7% |
| White | 2 | 0.4% |
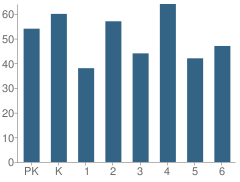
Number of Students Per Grade
| Number | Percent | |
|---|---|---|
| Pre-Kindergarten | 54 | 12.1% |
| Kindergarten | 60 | 13.4% |
| 1st Grade | 38 | 8.5% |
| 2nd Grade | 57 | 12.8% |
| 3rd Grade | 44 | 9.8% |
| 4th Grade | 64 | 14.3% |
| 5th Grade | 42 | 9.4% |
| 6th Grade | 47 | 10.5% |
| Ungraded | 41 | 9.2% |
Public Assistance (2010)
Estimated Percent of Students From Households That Receive Public Assistance: 81-90%
Attendance & Suspensions (2009)
Attendance Rate
School:
90.0%
State:
93.0%
Percent of Students Suspended
School:
10.0%
District:
7.0%
State:
5.0%
Teacher Certification & Qualifications (2010)
Percent of Teachers Without a Valid Teaching Certificate
School:
3.0%
District:
2.0%
Percent of Teachers Out of Certification
School:
3.0%
District:
9.0%
Percent of Classes Taught by Teachers Without Appropriate Certification
School:
3.0%
District:
9.0%
Percent of Core Classes Not Being Taught by Highly Qualified Teachers
School:
3.0%
District:
8.0%
Teacher Experience & Educational Background (2010)
Percent of Teachers with Less Than 3 Years of Experience
School:
16.0%
District:
10.0%
Percent of Teachers with Master's or Ph.D.
School:
19.0%
District:
40.0%
Teacher Turnover Rates (2010)
Turnover Rate For All Teachers
School:
24.0%
District:
20.0%
Turnover Rate For Teachers with Less Than 5 Years of Experience
School:
22.0%
District:
25.0%
Source: NY Department of Education, Source: NCES 2009-2010
School Ratings and Reviews
Be The First To Review P.S. 76 A. Phillip Randolph School!
School Map and Similar Schools Nearby
Click to Activate Map of Nearby School Campuses
Private
Public
This School
Similar Schools Nearby
| P.S. 242 Mgp Brown Computer School KG-5 | 218 Students | 0.2 miles away | Not Yet Rated | |
| P.S. 180 Hugo Newman School PK-8 | 616 Students | 0.3 miles away | Not Yet Rated | |
| P.S. 154 Harriet Tubman School PK-5 | 398 Students | 0.3 miles away | Not Yet Rated | |
| P.S. 125 Ralph Bunche School KG-5 | 238 Students | 0.3 miles away | Not Yet Rated | |
| P.S. 149 Sojourner Truth School PK-8 | 427 Students | 0.4 miles away | Not Yet Rated | |
| P.S. 241 Family Academy KG-8 | 232 Students | 0.4 miles away | Not Yet Rated | |
| P.S. 36 Margaret Douglas School PK-3 | 597 Students | 0.4 miles away |  4 out of 5 | |
| P.S. 129 John H. Finley School PK-7 | 579 Students | 0.6 miles away |  5 out of 5 | |
| P.S. 185 John M. Langston School PK-2 | 239 Students | 0.6 miles away | Not Yet Rated | - |
| P.S. 208 Alaine L. Locke School 3-5 | 206 Students | 0.6 miles away | Not Yet Rated | |
Compare This School To Nearby Schools ->
School Community Forum

Join a discussion about P.S. 76 A. Phillip Randolph School and talk to others in the community including students, parents, teachers, and administrators.
Popular Discussion Topics
- Admissions and Registration Questions (e.g. Dress Code and Discipline Policy)
- School Calendar and Upcoming Events (e.g. Graduation)
- After School Programs, Extracurricular Activities, and Athletics (e.g. Football)
- News and Announcements (e.g. Yearbook and Class Supply List Details)
- Graduate and Alumni Events (e.g. Organizing Class Reunions)
Navigation
Can't Find What You Are Looking For?
Rankings
Nearby Cities
Sponsored Links
K-12 Articles

Just a Harmless Vanilla Bean?
Some of the greatest, most used, and most profitable breakthroughs in science have not been made by...
Some of the greatest, most used, and most profitable breakthroughs in science have not been made by...

Cut the Credit and Save You Some Money
Today’s society glorifies a get-it-now mentality. Children learn this early. You probably noticed...
Today’s society glorifies a get-it-now mentality. Children learn this early. You probably noticed...

Is Your Child Happy at School?
As a parent, you’d love to have your child share all of his feelings with you. It would be so easy...
As a parent, you’d love to have your child share all of his feelings with you. It would be so easy...