James A Allison Elementary School 3
Rating
Not Available
Not Available

No Reviews Yet
Find Old Friends From James A Allison Elementary School 3
Use the form below to search for alumni from James a Allison Elementary School 3.
School Description
School Summary and Highlights
- Enrolls 208 elementary school students from grades KG-6
- Ranks 670th out of 1,142 elementary schools in IN.
Additional Contact Information
- Mailing Address: 5240 W 22nd St, Speedway, IN 46224
- Principal or Admin: Bedwell Jay L
- Fax: (317) 486-4847
- Website: www.speedwayschools.org
School Operational Details
- Title I EligibleAll students of this school are eligible for participation in authorized programs.
School District Details
- School Town of Speedway District
- Per-Pupil Spending: $8,308
- Graduation Rate: 70.5%
- Students Per Teacher: 16.8
- Enrolled Students: 1,509
Faculty Details and Student Enrollment
Students and Faculty
- Total Students Enrolled: 208
- Total Full Time "Equivalent" Teachers: 12.3
- Average Student-To-Teacher Ratio: 17.0
Students Gender Breakdown
- Males: 97 (46.6%)
- Females: 100 (48.1%)
Free Lunch Student Eligibility Breakdown
- Eligible for Reduced Lunch: 20 (9.6%)
- Eligible for Free Lunch: 117 (56.3%)
- Eligible for Either Reduced or Free Lunch: 137 (65.9%)
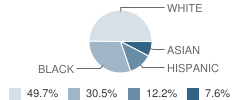
Student Enrollment Distribution by Race / Ethnicity
| Number | Percent | |
|---|---|---|
| American Indian | - | - |
| Black | 60 | 28.8% |
| Asian | 15 | 7.2% |
| Hispanic | 24 | 11.5% |
| White | 98 | 47.1% |
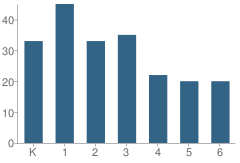
Number of Students Per Grade
| Number | Percent | |
|---|---|---|
| Kindergarten | 33 | 15.9% |
| 1st Grade | 45 | 21.6% |
| 2nd Grade | 33 | 15.9% |
| 3rd Grade | 35 | 16.8% |
| 4th Grade | 22 | 10.6% |
| 5th Grade | 20 | 9.6% |
| 6th Grade | 20 | 9.6% |
Source: IN Department of Education, Source: NCES 2009-2010
School Ratings and Reviews
Be The First To Review James A Allison Elementary School 3!
School Map and Similar Schools Nearby
Click to Activate Map of Nearby School Campuses
Private
Public
This School
Similar Schools Nearby
| Arthur C Newby Elementary School 2 KG-6 | 166 Students | 0.5 miles away | Not Yet Rated | |
| Frank H Wheeler Elementary School 4 KG-6 | 231 Students | 0.7 miles away | Not Yet Rated | |
| Carl G Fisher Elementary School 1 KG-6 | 178 Students | 0.8 miles away |  5 out of 5 | |
| Clarence Farrington School 61 KG-6 | 438 Students | 1.4 miles away | Not Yet Rated | |
| Carl Wilde School 79 PK-6 | 616 Students | 1.5 miles away | Not Yet Rated | |
| Lew Wallace School 107 KG-6 | 415 Students | 1.6 miles away | Not Yet Rated | |
| Meredith Nicholson School 96 KG-6 | 436 Students | 1.8 miles away | Not Yet Rated | |
| Ernie Pyle School 90 PK-6 | 341 Students | 2.0 miles away | Not Yet Rated | |
| Stephen Collins Foster School 67 KG-8 | 751 Students | 2.1 miles away | Not Yet Rated | |
| Chapelwood Elementary School PK-6 | 764 Students | 2.2 miles away | Not Yet Rated | |
Compare This School To Nearby Schools ->
School Community Forum

Join a discussion about James A Allison Elementary School 3 and talk to others in the community including students, parents, teachers, and administrators.
Popular Discussion Topics
- Admissions and Registration Questions (e.g. Dress Code and Discipline Policy)
- School Calendar and Upcoming Events (e.g. Graduation)
- After School Programs, Extracurricular Activities, and Athletics (e.g. Football)
- News and Announcements (e.g. Yearbook and Class Supply List Details)
- Graduate and Alumni Events (e.g. Organizing Class Reunions)
Navigation
Can't Find What You Are Looking For?
Nearby Cities
Sponsored Links
K-12 Articles

Teaching Kids to Deal with Peer Pressure
Parents usually become very concerned when they hear the term "peer pressure." However, peer...
Parents usually become very concerned when they hear the term "peer pressure." However, peer...

School's out for Recess
Recess used to be the best part of school; that and lunch. But today, a shocking two-thirds of...
Recess used to be the best part of school; that and lunch. But today, a shocking two-thirds of...

Where in the World is Carmen Sandiego?
One of the sensations on YouTube highlights the state of our education system. The spot was...
One of the sensations on YouTube highlights the state of our education system. The spot was...