Sundance Elementary School
Rating
Not Available
Not Available

5 out of 5 | 1 Review
Find Old Friends From Sundance Elementary School
Use the form below to search for alumni from Sundance Elementary School.
School Description
School Summary and Highlights
- Enrolls 740 preschool and elementary school students from grades PK-8
- Ranks 235th out of 660 middle schools in AZ.
Additional Contact Information
- Mailing Address: 7051 W Cholla St., Peoria, AZ 85345
School Operational Details
- Title I EligibleAll students of this school are eligible for participation in authorized programs.
School District Details
- Peoria Unified School District
- Per-Pupil Spending: $6,688
- Graduation Rate: 83.0%
- Dropout Rate: 1.5%
- Students Per Teacher: 18.5
- Enrolled Students: 37,422
Faculty Details and Student Enrollment
Students and Faculty
- Total Students Enrolled: 740
- Total Full Time "Equivalent" Teachers: 43.4
- Average Student-To-Teacher Ratio: 17.0
Students Gender Breakdown
- Males: 361 (48.8%)
- Females: 379 (51.2%)
Free Lunch Student Eligibility Breakdown
- Eligible for Reduced Lunch: 74 (10.0%)
- Eligible for Free Lunch: 305 (41.2%)
- Eligible for Either Reduced or Free Lunch: 379 (51.2%)
Student Enrollment Distribution by Race / Ethnicity
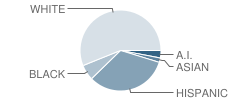
| Number | Percent | |
|---|---|---|
| American Indian | 22 | 3.0% |
| Black | 46 | 6.2% |
| Asian | 13 | 1.8% |
| Hispanic | 244 | 33.0% |
| White | 415 | 56.1% |
Number of Students Per Grade
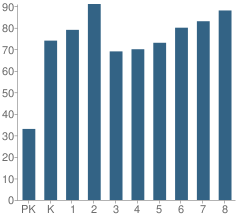
| Number | Percent | |
|---|---|---|
| Pre-Kindergarten | 33 | 4.5% |
| Kindergarten | 74 | 10.0% |
| 1st Grade | 79 | 10.7% |
| 2nd Grade | 91 | 12.3% |
| 3rd Grade | 69 | 9.3% |
| 4th Grade | 70 | 9.5% |
| 5th Grade | 73 | 9.9% |
| 6th Grade | 80 | 10.8% |
| 7th Grade | 83 | 11.2% |
| 8th Grade | 88 | 11.9% |
Faculty Educational Background (2006-07)
- Teachers with a Bachelor's Degree: 76%
- Teachers with a Master's Degree or Higher:24%
Faculty Salary and Experience (2006-2007)
- Average Teaching Experience: 12 Years
- Average Salary: $47,487
Teacher Experience by Number of Years
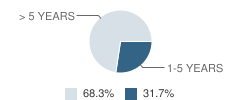
| Salary | Percent | |
|---|---|---|
| 1-5 Years of Teaching Experience | $36,589 | 32% |
| More Than 5 Years of Teaching Experience | $52,547 | 68% |
Source: AZ Department of Education, Source: NCES 2009-2010
School Ratings and Reviews
Overall Rating: 5

5 out of 5 | 1 Review
The Overall Rating is the school's average rating from parents, students, school faculty and staff. The highest rating is five apples and the lowest is one apple.
Share Your Review About This School
1 review for Sundance Elementary School
- Reviewed by Parent/Guardian on September 10, 2009
- Rating:
 (5 / 5) Flag as inappropriate
 - Great school for our daughter. The school staff is excellent in evey way.
We have gone to the school on a few occasions to discuss situations & have been very pleased with the outcome.
Our daughter needs help with her English & they have a great ESL program with great teachers that work hard with the kids.
School Map and Similar Schools Nearby
Click to Activate Map of Nearby School Campuses
Private
Public
This School
Similar Schools Nearby
| Peoria Ecampus School KG-12 | 9 Students | 0.5 miles away | Not Yet Rated | - |
| Ira A Murphy School PK-8 | 588 Students | 0.6 miles away |  5 out of 5 | |
| Copperwood School KG-8 | 919 Students | 0.7 miles away | Not Yet Rated | |
| Peoria Elementary School PK-8 | 725 Students | 1.0 miles away | Not Yet Rated | |
| Oakwood Elementary School KG-8 | 762 Students | 1.0 miles away | 5 out of 5 | |
| Sahuaro Ranch School KG-8 | 627 Students | 1.1 miles away | Not Yet Rated | |
| Santa Fe Elementary School PK-8 | 706 Students | 1.3 miles away | 5 out of 5 | |
| Desert Valley Elementary School KG-8 | 622 Students | 1.4 miles away | Not Yet Rated | |
| Oasis Elementary School PK-8 | 684 Students | 1.5 miles away | Not Yet Rated | |
| Marshall Ranch Elementary School PK-8 | 717 Students | 1.8 miles away | Not Yet Rated | |
Compare This School To Nearby Schools ->
School Community Forum

Join a discussion about Sundance Elementary School and talk to others in the community including students, parents, teachers, and administrators.
Popular Discussion Topics
- Admissions and Registration Questions (e.g. Dress Code and Discipline Policy)
- School Calendar and Upcoming Events (e.g. Graduation)
- After School Programs, Extracurricular Activities, and Athletics (e.g. Football)
- News and Announcements (e.g. Yearbook and Class Supply List Details)
- Graduate and Alumni Events (e.g. Organizing Class Reunions)
Navigation
Can't Find What You Are Looking For?
Nearby Cities
Sponsored Links
K-12 Articles

Is Your Child's Teacher a Bully?
We've all heard about kids being bullied by peers. Kids taunt, tease, pull hair, shove and push...
We've all heard about kids being bullied by peers. Kids taunt, tease, pull hair, shove and push...

The Importance of Reading for Children Preschool to Grade Three
The first teachers of children are their parents. From the time they are infants, children need to...
The first teachers of children are their parents. From the time they are infants, children need to...

How to Get the Best Supplies for Your Money
School supply lists can seem unending, and the price can add up very quickly. But do we really...
School supply lists can seem unending, and the price can add up very quickly. But do we really...