Highlands High School
Rating
Not Available
Not Available

1 out of 5 | 2 Reviews
Find Old Friends From Highlands High School
Use the form below to search for alumni from Highlands High School.
School Description
School Summary and Highlights
- Enrolls 1,385 middle and high school students from grades 7-12
- 2010 Overall School AYP Met Status: No
School Operational Details
- Title I EligibleAll students of this school are eligible for participation in authorized programs.
Faculty Details and Student Enrollment
Students and Faculty
- Total Students Enrolled: 1,385
- Total Full Time "Equivalent" Teachers: 71.0
- Average Student-To-Teacher Ratio: 19.5
Students Gender Breakdown
- Males: 724 (52.3%)
- Females: 661 (47.7%)
Free Lunch Student Eligibility Breakdown
- Eligible for Reduced Lunch: 133 (9.6%)
- Eligible for Free Lunch: 914 (66.0%)
- Eligible for Either Reduced or Free Lunch: 1,047 (75.6%)
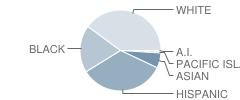
Student Enrollment Distribution by Race / Ethnicity
| Number | Percent | |
|---|---|---|
| American Indian | 7 | 0.5% |
| Black | 246 | 17.8% |
| Asian | 80 | 5.8% |
| Hispanic | 443 | 32.0% |
| White | 517 | 37.3% |
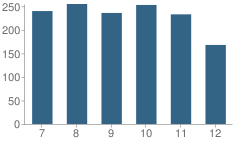
Number of Students Per Grade
| Number | Percent | |
|---|---|---|
| 7th Grade | 240 | 17.3% |
| 8th Grade | 255 | 18.4% |
| 9th Grade | 236 | 17.0% |
| 10th Grade | 253 | 18.3% |
| 11th Grade | 233 | 16.8% |
| 12th Grade | 168 | 12.1% |
Graduates Information (2010)
Graduation Rate
School:
83.5%
District:
76.7%
State:
78.6%
Teacher Education Background (2009)
Percent With Ph.D.
School:
3.6%
District:
9.6%
Percent With Master's Degree
School:
21.4%
District:
27.0%
Percent With Bachelor's Degree
School:
6.0%
District:
1.7%
Teacher Credentials & Experience (2009)
Percent of Teachers With Credentials: 98.6%
Number of Certificated Staff: 84.0
Average Number of Years of Teacher Experience: 11.4
Average Age
School:
44.4
District:
48.3
Source: CA Department of Education, Source: NCES 2009-2010
School Ratings and Reviews
Overall Rating: 1

1 out of 5 | 2 Reviews
The Overall Rating is the school's average rating from parents, students, school faculty and staff. The highest rating is five apples and the lowest is one apple.
Share Your Review About This School
2 reviews for Highlands High School
- Reviewed by Former Student on January 27, 2011
- Rating:
 (1 / 5) Flag as inappropriate
 - This school was the worst ever,in all my years of schooling. The curriculum was poor and the school was diry. Staff and students didn't respect eachother,they hardley respected themselves. This school is a joke! Sacramento magazine ranked this school a 2,on a scale of 1-10. If you care about you or your childs education,look into somewhere else if at a possible.
- Reviewed by Parent or Guardian on January 27, 2011
- Rating: (1 / 5) Flag as inappropriate
School Map and Similar Schools Nearby
Click to Activate Map of Nearby School Campuses
Private
Public
This School
Similar Schools Nearby
| Foothill High School 9-12 | 1,349 Students | 0.6 miles away | Not Yet Rated | |
| Foothill Farms Junior High School 7-8 | 723 Students | 1.0 miles away | Not Yet Rated | |
| Antelope High School 9-12 | 1,332 Students | 1.6 miles away | Not Yet Rated | - |
| Center High School 9-12 | 1,437 Students | 2.8 miles away | Not Yet Rated | |
| Mesa Verde High School 9-12 | 1,181 Students | 3.4 miles away |  4 out of 5 | |
| Del Campo High School 9-12 | 1,897 Students | 3.5 miles away | Not Yet Rated | |
| Valley Oaks School KG-12 | 11 Students | 3.6 miles away | Not Yet Rated | - |
| Mira Loma High School 9-12 | 1,625 Students | 3.8 miles away | Not Yet Rated | |
| San Juan High School 9-12 | 660 Students | 3.9 miles away | Not Yet Rated | |
| Rio Linda High School 9-12 | 2,007 Students | 4.4 miles away | Not Yet Rated | |
Compare This School To Nearby Schools ->
School Community Forum

Join a discussion about Highlands High School and talk to others in the community including students, parents, teachers, and administrators.
Popular Discussion Topics
- Admissions and Registration Questions (e.g. Dress Code and Discipline Policy)
- School Calendar and Upcoming Events (e.g. Graduation)
- After School Programs, Extracurricular Activities, and Athletics (e.g. Football)
- News and Announcements (e.g. Yearbook and Class Supply List Details)
- Graduate and Alumni Events (e.g. Organizing Class Reunions)
Navigation
Can't Find What You Are Looking For?
Rankings
Nearby Cities
Sponsored Links
K-12 Articles

Those Pesky Little Transitions
Transitions are rarely easy, yet we have to encounter them every day of our lives. For school-aged...
Transitions are rarely easy, yet we have to encounter them every day of our lives. For school-aged...

The Difference Between Boys and Girls
Boys and girls are different. Give a toddler girl a G.I. Joe and she'll probably try to mother it....
Boys and girls are different. Give a toddler girl a G.I. Joe and she'll probably try to mother it....

Who is Safe?
Between September 26 and October 2, 2006, there were three deadly school shootings and...
Between September 26 and October 2, 2006, there were three deadly school shootings and...