Trevista Ece-8 at Horace Mann School
Rating
Not Available
Not Available

No Reviews Yet
Find Old Friends From Trevista Ece-8 at Horace Mann School
Use the form below to search for alumni from Trevista Ece-8 at Horace Mann School.
School Description
School Summary and Highlights
- Enrolls 694 preschool and elementary school students from grades PK-8
Additional Contact Information
- Mailing Address: 4130 Navajo Street, Denver, CO 80211
School Operational Details
- Title I EligibleAll students of this school are eligible for participation in authorized programs.
School District Details
- Denver Public Schools District
- Per-Pupil Spending: $15,769
- Graduation Rate: 50.4%
- Dropout Rate: 13.8%
- Students Per Teacher: 17.0
- Enrolled Students: 77,267
Faculty Details and Student Enrollment
Students and Faculty
- Total Students Enrolled: 694
- Total Full Time "Equivalent" Teachers: 43.6
- Average Student-To-Teacher Ratio: 15.9
Students Gender Breakdown
- Males: 366 (52.7%)
- Females: 328 (47.3%)
Free Lunch Student Eligibility Breakdown
- Eligible for Reduced Lunch: 43 (6.2%)
- Eligible for Free Lunch: 607 (87.5%)
- Eligible for Either Reduced or Free Lunch: 650 (93.7%)
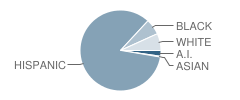
Student Enrollment Distribution by Race / Ethnicity
| Number | Percent | |
|---|---|---|
| American Indian | 16 | 2.3% |
| Black | 44 | 6.3% |
| Asian | 2 | 0.3% |
| Hispanic | 585 | 84.3% |
| White | 47 | 6.8% |
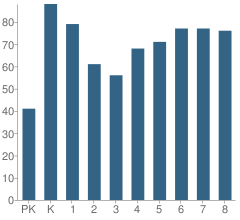
Number of Students Per Grade
| Number | Percent | |
|---|---|---|
| Pre-Kindergarten | 41 | 5.9% |
| Kindergarten | 88 | 12.7% |
| 1st Grade | 79 | 11.4% |
| 2nd Grade | 61 | 8.8% |
| 3rd Grade | 56 | 8.1% |
| 4th Grade | 68 | 9.8% |
| 5th Grade | 71 | 10.2% |
| 6th Grade | 77 | 11.1% |
| 7th Grade | 77 | 11.1% |
| 8th Grade | 76 | 11.0% |
Source: CO Department of Education, Source: NCES 2009-2010
School Ratings and Reviews
Be The First To Review Trevista Ece-8 at Horace Mann School!
School Map and Similar Schools Nearby
Click to Activate Map of Nearby School Campuses
Private
Public
This School
Similar Schools Nearby
| Bryant Webster Elementary School PK-8 | 456 Students | 0.5 miles away | Not Yet Rated | |
| Academia Ana Marie Sandoval School PK-6 | 386 Students | 0.7 miles away | Not Yet Rated | |
| Garden Place Elementary School PK-5 | 354 Students | 0.9 miles away | Not Yet Rated | |
| Columbian Elementary School PK-5 | 319 Students | 1.1 miles away | Not Yet Rated | |
| Beach Court Elementary School PK-5 | 314 Students | 1.2 miles away | Not Yet Rated | |
| Valdez Elementary School PK-7 | 389 Students | 1.3 miles away | Not Yet Rated | |
| Gilpin Elementary School PK-8 | 333 Students | 1.7 miles away | Not Yet Rated | |
| Cole Arts and Science Academy PK-8 | 624 Students | 1.9 miles away | Not Yet Rated | |
| Polaris at Ebert Elementary School KG-5 | 335 Students | 2.0 miles away | Not Yet Rated | |
| Edison Elementary School PK-5 | 566 Students | 2.0 miles away |  5 out of 5 | |
Compare This School To Nearby Schools ->
School Community Forum

Join a discussion about Trevista Ece-8 at Horace Mann School and talk to others in the community including students, parents, teachers, and administrators.
Popular Discussion Topics
- Admissions and Registration Questions (e.g. Dress Code and Discipline Policy)
- School Calendar and Upcoming Events (e.g. Graduation)
- After School Programs, Extracurricular Activities, and Athletics (e.g. Football)
- News and Announcements (e.g. Yearbook and Class Supply List Details)
- Graduate and Alumni Events (e.g. Organizing Class Reunions)
Navigation
Can't Find What You Are Looking For?
Rankings
Sponsored Links
K-12 Articles

Helping Your Child Leave the Nest
It's all come down to this: Eighteen years of good times and bad, and now your baby bird is ready...
It's all come down to this: Eighteen years of good times and bad, and now your baby bird is ready...

The Importance of Reading for Children Preschool to Grade Three
The first teachers of children are their parents. From the time they are infants, children need to...
The first teachers of children are their parents. From the time they are infants, children need to...

Bullycide: What is It and How Can It Be Prevented?
Disclaimer: This article expresses my opinion that has been formed by personal experience and...
Disclaimer: This article expresses my opinion that has been formed by personal experience and...