New Horizons School
Rating
Not Available
Not Available

No Reviews Yet
Find Old Friends From New Horizons School
Use the form below to search for alumni from New Horizons School.
School Description
School Summary and Highlights
- Enrolls 55 elementary, middle, and high school students from grades 2-11
- 2010 Overall School AYP Met Status: Yes
Additional Contact Information
- Mailing Address: P O Box 549, Goldthwaite, TX 76844
School Operational Details
- Alternative School
- Title I EligibleAll students of this school are eligible for participation in authorized programs.
- Charter School
School District Details
- Orenda Charter School District
- Per-Pupil Spending: $21,500
- Dropout Rate: 23.1%
- Students Per Teacher: 8.4
- Enrolled Students: 185
Faculty Details and Student Enrollment
Students and Faculty
- Total Students Enrolled: 55
- Total Full Time "Equivalent" Teachers: 9.0
- Average Student-To-Teacher Ratio: 6.1
Students Gender Breakdown
- Males: 39 (70.9%)
- Females: 16 (29.1%)
Free Lunch Student Eligibility Breakdown
- Eligible for Reduced Lunch: - (-)
- Eligible for Free Lunch: 52 (94.5%)
- Eligible for Either Reduced or Free Lunch: 52 (94.5%)
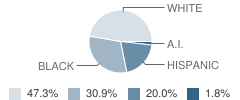
Student Enrollment Distribution by Race / Ethnicity
| Number | Percent | |
|---|---|---|
| American Indian | 1 | 1.8% |
| Black | 17 | 30.9% |
| Asian | - | - |
| Hispanic | 11 | 20.0% |
| White | 26 | 47.3% |
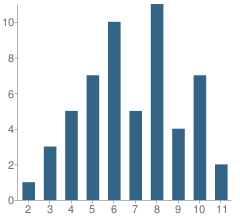
Number of Students Per Grade
| Number | Percent | |
|---|---|---|
| 2nd Grade | 1 | 1.8% |
| 3rd Grade | 3 | 5.5% |
| 4th Grade | 5 | 9.1% |
| 5th Grade | 7 | 12.7% |
| 6th Grade | 10 | 18.2% |
| 7th Grade | 5 | 9.1% |
| 8th Grade | 11 | 20.0% |
| 9th Grade | 4 | 7.3% |
| 10th Grade | 7 | 12.7% |
| 11th Grade | 2 | 3.6% |
Faculty Breakdown (2010)
Average Teacher Experience
School:
1.7
District:
6.7
State:
11.3
Percent of Teachers With 1-5 Years Experience
School:
44.4%
District:
41.1%
State:
31.0%
Percent of Teachers With 6-10 Years Experience
School:
11.1%
District:
9.1%
State:
20.3%
Faculty Salary (2010)
School Administration Average Base Salary
School:
$63,816
District:
$77,009
State:
$70,209
Teacher Average Base Salary
School:
$37,757
District:
$45,088
State:
$48,263
Beginning Teacher Average Base Salary
School:
$30,670
District:
$33,228
State:
$41,165
Teacher With 1-5 Years Experience Average Base Salary
School:
$41,613
State:
$43,527
Teacher With 6-10 Years Experience Average Base Salary
School:
$50,691
State:
$46,149
Source: TX Department of Education, Source: NCES 2009-2010
School Ratings and Reviews
Be The First To Review New Horizons School!
School Map and Similar Schools Nearby
Click to Activate Map of Nearby School Campuses
Private
Public
This School
Similar Schools Nearby
| Williams House School 1-12 | 26 Students | 19.6 miles away | Not Yet Rated | |
| Paradigm Accelerated Charter School - Brownwood 9-12 | 63 Students | 29.6 miles away | Not Yet Rated | |
Compare This School To Nearby Schools ->
Navigation
Can't Find What You Are Looking For?
Nearby Cities
Sponsored Links
K-12 Articles

Who is Safe?
Between September 26 and October 2, 2006, there were three deadly school shootings and...
Between September 26 and October 2, 2006, there were three deadly school shootings and...

Teaching Your Kids About Respect, Values and Violence
These days it seems that every newscast reports at least once incident of violence. As parents, we...
These days it seems that every newscast reports at least once incident of violence. As parents, we...

Hurt: A Book Report
My last book report was over 15 years ago, and I'm a bit rusty, but here goes (Don't forget: book...
My last book report was over 15 years ago, and I'm a bit rusty, but here goes (Don't forget: book...