Walnut Springs School
Rating
Not Available
Not Available

No Reviews Yet
Find Old Friends From Walnut Springs School
Use the form below to search for alumni from Walnut Springs School.
School Description
School Summary and Highlights
- Enrolls 212 school students from grades PK-12
- 2010 Overall School AYP Met Status: Yes
Additional Contact Information
- Mailing Address: P O Box 63, Walnut Springs, TX 76690
School Operational Details
- Title I EligibleAll students of this school are eligible for participation in authorized programs.
School District Details
- Walnut Springs Independent School District (ISD)
- Per-Pupil Spending: $10,208
- Graduation Rate: 72.2%
- Dropout Rate: 6.5%
- Students Per Teacher: 10.6
- Enrolled Students: 212
Faculty Details and Student Enrollment
Students and Faculty
- Total Students Enrolled: 212
- Total Full Time "Equivalent" Teachers: 20.0
- Average Student-To-Teacher Ratio: 10.6
Students Gender Breakdown
- Males: 123 (58.0%)
- Females: 89 (42.0%)
Free Lunch Student Eligibility Breakdown
- Eligible for Reduced Lunch: 14 (6.6%)
- Eligible for Free Lunch: 164 (77.4%)
- Eligible for Either Reduced or Free Lunch: 178 (84.0%)
Student Enrollment Distribution by Race / Ethnicity
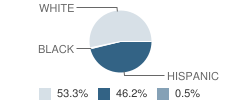
| Number | Percent | |
|---|---|---|
| American Indian | - | - |
| Black | 1 | 0.5% |
| Asian | - | - |
| Hispanic | 98 | 46.2% |
| White | 113 | 53.3% |
Number of Students Per Grade
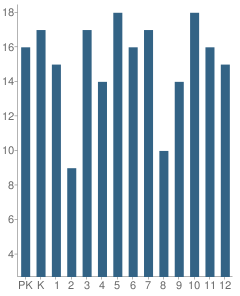
| Number | Percent | |
|---|---|---|
| Pre-Kindergarten | 16 | 7.5% |
| Kindergarten | 17 | 8.0% |
| 1st Grade | 15 | 7.1% |
| 2nd Grade | 9 | 4.2% |
| 3rd Grade | 17 | 8.0% |
| 4th Grade | 14 | 6.6% |
| 5th Grade | 18 | 8.5% |
| 6th Grade | 16 | 7.5% |
| 7th Grade | 17 | 8.0% |
| 8th Grade | 10 | 4.7% |
| 9th Grade | 14 | 6.6% |
| 10th Grade | 18 | 8.5% |
| 11th Grade | 16 | 7.5% |
| 12th Grade | 15 | 7.1% |
Breakdown of College Ready Graduates (2009)
Percent Ready For College in Reading
School:
44.0%
District:
44.0%
State:
62.0%
Percent Ready For College in Math
School:
50.0%
District:
29.0%
State:
60.0%
Faculty Breakdown (2010)
Average Teacher Experience
School:
10.0
District:
10.0
State:
11.3
Percent of Teachers With 1-5 Years Experience
School:
33.8%
District:
33.8%
State:
31.0%
Percent of Teachers With 6-10 Years Experience
School:
12.6%
District:
12.6%
State:
20.3%
Percent of Teachers With 11-20 Years Experience
School:
29.0%
District:
29.0%
State:
24.4%
Percent of Teachers With Greater Than 20 Years Experience
School:
14.6%
District:
14.6%
State:
18.3%
Faculty Salary (2010)
School Administration Average Base Salary
School:
$63,598
District:
$63,598
State:
$70,209
Teacher Average Base Salary
School:
$39,993
District:
$39,993
State:
$48,263
Beginning Teacher Average Base Salary
School:
$33,719
District:
$33,719
State:
$41,165
Teacher With 1-5 Years Experience Average Base Salary
School:
$33,813
State:
$43,527
Teacher With 6-10 Years Experience Average Base Salary
School:
$38,243
State:
$46,149
Teacher With 11-20 Years Experience Average Base Salary
School:
$44,957
State:
$50,153
Teacher With Greater Than 20 Years Experience Average Base Salary
School:
$50,267
State:
$58,427
Source: TX Department of Education, Source: NCES 2009-2010
School Ratings and Reviews
Be The First To Review Walnut Springs School!
School Map and Similar Schools Nearby
Click to Activate Map of Nearby School Campuses
Private
Public
This School
Similar Schools Nearby
| Iredell School PK-12 | 132 Students | 8.2 miles away |  5 out of 5 | |
| Morgan School PK-12 | 131 Students | 8.7 miles away | Not Yet Rated | |
| Meridian High School 7-12 | 228 Students | 10.3 miles away | Not Yet Rated | |
| Glen Rose High School 9-12 | 520 Students | 12.5 miles away | Not Yet Rated | |
| Glen Rose Junior High School 6-8 | 382 Students | 13.1 miles away | 5 out of 5 | |
| Kopperl School PK-12 | 250 Students | 14.8 miles away | Not Yet Rated | |
| Hico Junior High School 6-8 | 135 Students | 16.5 miles away | 5 out of 5 | |
| Hico High School 9-12 | 224 Students | 16.6 miles away | Not Yet Rated | |
| Cranfills Gap School PK-12 | 108 Students | 19.5 miles away | Not Yet Rated | |
| Clifton High School 9-12 | 337 Students | 20.5 miles away | Not Yet Rated | |
Compare This School To Nearby Schools ->
School Community Forum

Join a discussion about Walnut Springs School and talk to others in the community including students, parents, teachers, and administrators.
Popular Discussion Topics
- Admissions and Registration Questions (e.g. Dress Code and Discipline Policy)
- School Calendar and Upcoming Events (e.g. Graduation)
- After School Programs, Extracurricular Activities, and Athletics (e.g. Football)
- News and Announcements (e.g. Yearbook and Class Supply List Details)
- Graduate and Alumni Events (e.g. Organizing Class Reunions)
Navigation
Can't Find What You Are Looking For?
Nearby Cities
Sponsored Links
K-12 Articles

Is Your Child Happy at School?
As a parent, you'd love to have your child share all of his feelings with you. It would be so easy...
As a parent, you'd love to have your child share all of his feelings with you. It would be so easy...

Transform Your Middle School Slacker into a Scholar
All children need motivation to learn. Have your child's grades decreased since he started middle...
All children need motivation to learn. Have your child's grades decreased since he started middle...

Teaching Children with Learning Disabilities to Make Friends
Children with learning disabilities often have trouble making and retaining friendships. Some kids...
Children with learning disabilities often have trouble making and retaining friendships. Some kids...