Mary G. Porter Traditional School
Rating
Not Available
Not Available

No Reviews Yet
Find Old Friends From Mary G. Porter Traditional School
Use the form below to search for alumni from Mary G. Porter Traditional School.
School Description
School Summary and Highlights
- Enrolls 651 elementary school students from grades 1-8
- Ranks 12th out of 419 middle schools in VA.
Additional Contact Information
- Mailing Address: 15311 Forest Grove Drive, Woodbridge, VA 22191
School Operational Details
- Magnet School
School District Details
- Prince William County Public Schools District
- Per-Pupil Spending: $10,372
- Graduation Rate: 78.8%
- Dropout Rate: 2.1%
- Students Per Teacher: 19.3
- Enrolled Students: 76,861
Faculty Details and Student Enrollment
Students and Faculty
- Total Students Enrolled: 651
- Total Full Time "Equivalent" Teachers: 29.2
- Average Student-To-Teacher Ratio: 22.3
Students Gender Breakdown
- Males: 265 (40.7%)
- Females: 334 (51.3%)
Free Lunch Student Eligibility Breakdown
- Eligible for Reduced Lunch: 36 (5.5%)
- Eligible for Free Lunch: 74 (11.4%)
- Eligible for Either Reduced or Free Lunch: 110 (16.9%)
Student Enrollment Distribution by Race / Ethnicity
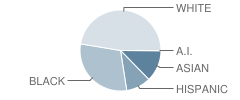
| Number | Percent | |
|---|---|---|
| American Indian | 1 | 0.2% |
| Black | 180 | 27.6% |
| Asian | 75 | 11.5% |
| Hispanic | 59 | 9.1% |
| White | 284 | 43.6% |
Number of Students Per Grade
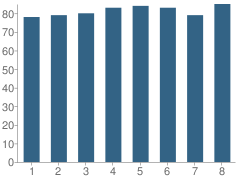
| Number | Percent | |
|---|---|---|
| 1st Grade | 78 | 12.0% |
| 2nd Grade | 79 | 12.1% |
| 3rd Grade | 80 | 12.3% |
| 4th Grade | 83 | 12.7% |
| 5th Grade | 84 | 12.9% |
| 6th Grade | 83 | 12.7% |
| 7th Grade | 79 | 12.1% |
| 8th Grade | 85 | 13.1% |
Source: VA Department of Education, Source: NCES 2009-2010
School Ratings and Reviews
Be The First To Review Mary G. Porter Traditional School!
School Map and Similar Schools Nearby
Click to Activate Map of Nearby School Campuses
Private
Public
This School
Similar Schools Nearby
| Leesylvania Elementary School PK-5 | 654 Students | 0.9 miles away | Not Yet Rated | |
| Featherstone Elementary School PK-5 | 438 Students | 1.1 miles away | Not Yet Rated | |
| Fannie W. Fitzgerald Elementary School PK-5 | 873 Students | 1.7 miles away | Not Yet Rated | |
| Potomac View Elementary School PK-5 | 668 Students | 1.8 miles away |  5 out of 5 | |
| Marumsco Hills Elementary School PK-5 | 577 Students | 2.0 miles away | 5 out of 5 | |
| Mary Williams Elementary School PK-5 | 708 Students | 2.4 miles away | Not Yet Rated | |
| Dale City Elementary School PK-5 | 445 Students | 2.4 miles away | Not Yet Rated | |
| Elizabeth Vaughan Elementary School PK-5 | 685 Students | 2.4 miles away | Not Yet Rated | |
| River Oaks Elementary School PK-5 | 621 Students | 2.5 miles away | Not Yet Rated | |
| Neabsco Elementary School PK-5 | 506 Students | 2.7 miles away | 5 out of 5 | |
Compare This School To Nearby Schools ->
School Community Forum

Join a discussion about Mary G. Porter Traditional School and talk to others in the community including students, parents, teachers, and administrators.
Popular Discussion Topics
- Admissions and Registration Questions (e.g. Dress Code and Discipline Policy)
- School Calendar and Upcoming Events (e.g. Graduation)
- After School Programs, Extracurricular Activities, and Athletics (e.g. Football)
- News and Announcements (e.g. Yearbook and Class Supply List Details)
- Graduate and Alumni Events (e.g. Organizing Class Reunions)
Navigation
Can't Find What You Are Looking For?
Rankings
Nearby Cities
Sponsored Links
K-12 Articles

Helping Young Children with Printing and Cursive Writing
Is your child experiencing difficulty printing or writing? Is he unable to print or write legibly,...
Is your child experiencing difficulty printing or writing? Is he unable to print or write legibly,...

The Cervical Cancer Vaccine
All across North America girls between the ages of 11 and 12 have the opportunity to be vaccinated...
All across North America girls between the ages of 11 and 12 have the opportunity to be vaccinated...

School Violence: Can It Be Stopped
It’s a fact that violence in schools is prevalent in today’s society. We hear of school shootings,...
It’s a fact that violence in schools is prevalent in today’s society. We hear of school shootings,...