Ed & Verma Pastor Elementary School
Rating
Not Available
Not Available

No Reviews Yet
Find Old Friends From Ed & Verma Pastor Elementary School
Use the form below to search for alumni from Ed & Verma Pastor Elementary School.
School Description
School Summary and Highlights
- Enrolls 720 elementary school students from grades KG-8
- Ranks 433rd out of 660 middle schools in AZ.
School Operational Details
- Title I EligibleAll students of this school are eligible for participation in authorized programs.
School District Details
- Roosevelt Elementary District
- Per-Pupil Spending: $8,047
- Students Per Teacher: 17.9
- Enrolled Students: 11,079
Faculty Details and Student Enrollment
Students and Faculty
- Total Students Enrolled: 720
- Total Full Time "Equivalent" Teachers: 36.0
- Average Student-To-Teacher Ratio: 20.0
Students Gender Breakdown
- Males: 359 (49.9%)
- Females: 361 (50.1%)
Free Lunch Student Eligibility Breakdown
- Eligible for Reduced Lunch: 36 (5.0%)
- Eligible for Free Lunch: 625 (86.8%)
- Eligible for Either Reduced or Free Lunch: 661 (91.8%)
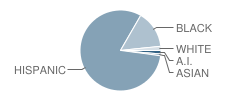
Student Enrollment Distribution by Race / Ethnicity
| Number | Percent | |
|---|---|---|
| American Indian | 10 | 1.4% |
| Black | 108 | 15.0% |
| Asian | 5 | 0.7% |
| Hispanic | 585 | 81.3% |
| White | 12 | 1.7% |
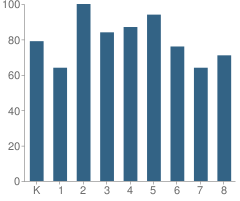
Number of Students Per Grade
| Number | Percent | |
|---|---|---|
| Kindergarten | 79 | 11.0% |
| 1st Grade | 64 | 8.9% |
| 2nd Grade | 100 | 13.9% |
| 3rd Grade | 84 | 11.7% |
| 4th Grade | 87 | 12.1% |
| 5th Grade | 94 | 13.1% |
| 6th Grade | 76 | 10.6% |
| 7th Grade | 64 | 8.9% |
| 8th Grade | 71 | 9.9% |
| Ungraded | 1 | 0.1% |
Faculty Educational Background (2006-07)
- Teachers with a Bachelor's Degree: 63%
- Teachers with a Master's Degree or Higher:37%
Faculty Salary and Experience (2006-2007)
- Average Teaching Experience: 6 Years
- Average Salary: $39,935
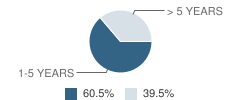
Teacher Experience by Number of Years
| Salary | Percent | |
|---|---|---|
| 1-5 Years of Teaching Experience | $36,081 | 61% |
| More Than 5 Years of Teaching Experience | $45,844 | 40% |
Source: AZ Department of Education, Source: NCES 2009-2010
School Ratings and Reviews
Be The First To Review Ed & Verma Pastor Elementary School!
School Map and Similar Schools Nearby
Click to Activate Map of Nearby School Campuses
Private
Public
This School
Similar Schools Nearby
| Ignacio Conchos School PK-8 | 433 Students | 0.5 miles away |  5 out of 5 | |
| Bernard Black Elementary School KG-8 | 951 Students | 0.7 miles away | Not Yet Rated | |
| John R Davis School PK-8 | 712 Students | 0.9 miles away | 5 out of 5 | |
| C J Jorgensen School PK-8 | 533 Students | 0.9 miles away | Not Yet Rated | |
| V H Lassen Elementary School KG-8 | 522 Students | 1.1 miles away | Not Yet Rated | |
| Sunland Elementary School KG-8 | 609 Students | 1.5 miles away |  4 out of 5 | |
| Valley View School KG-8 | 640 Students | 1.6 miles away | Not Yet Rated | |
| Southwest Elementary School KG-8 | 626 Students | 2.0 miles away | Not Yet Rated | |
| Maurice C. Cash Elementary School PK-8 | 761 Students | 2.2 miles away | Not Yet Rated | |
| Vista Del Sur Middle School PK-8 | 628 Students | 2.6 miles away | Not Yet Rated | |
Compare This School To Nearby Schools ->
School Community Forum

Join a discussion about Ed & Verma Pastor Elementary School and talk to others in the community including students, parents, teachers, and administrators.
Popular Discussion Topics
- Admissions and Registration Questions (e.g. Dress Code and Discipline Policy)
- School Calendar and Upcoming Events (e.g. Graduation)
- After School Programs, Extracurricular Activities, and Athletics (e.g. Football)
- News and Announcements (e.g. Yearbook and Class Supply List Details)
- Graduate and Alumni Events (e.g. Organizing Class Reunions)
Navigation
Can't Find What You Are Looking For?
Sponsored Links
K-12 Articles

How to Get the Best Supplies for Your Money
School supply lists can seem unending, and the price can add up very quickly. But do we really...
School supply lists can seem unending, and the price can add up very quickly. But do we really...

Summer Safety Tips to Keep Kids Safe
It won’t be long until kids run from the school, shrieking in delight because they’re free for the...
It won’t be long until kids run from the school, shrieking in delight because they’re free for the...

Homework Helps
School has started throughout the country and is well into the first month-some schools are...
School has started throughout the country and is well into the first month-some schools are...