Mt Graham High School
300 West Discovery Park Blvd, Safford, AZ 85546 | (928) 348-7060
- Grades: 9-12
- Student Enrollment: 132
Rating
Not Available
Not Available

No Reviews Yet
Find Old Friends From Mt Graham High School
Use the form below to search for alumni from Mt Graham High School.
School Description
School Summary and Highlights
- Enrolls 132 high school students from grades 9-12
- Ranks 305th out of 385 high schools in AZ.
Additional Contact Information
- Mailing Address: 300 W. Discovery Park Blvd., Safford, AZ 85546
School District Details
- Safford Unified District
- Per-Pupil Spending: $6,837
- Graduation Rate: 85.4%
- Dropout Rate: 6.9%
- Students Per Teacher: 19.1
- Enrolled Students: 3,187
Faculty Details and Student Enrollment
Students and Faculty
- Total Students Enrolled: 132
- Total Full Time "Equivalent" Teachers: 6.0
- Average Student-To-Teacher Ratio: 22.0
Students Gender Breakdown
- Males: 50 (37.9%)
- Females: 82 (62.1%)
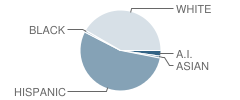
Student Enrollment Distribution by Race / Ethnicity
| Number | Percent | |
|---|---|---|
| American Indian | 3 | 2.3% |
| Black | 1 | 0.8% |
| Asian | 1 | 0.8% |
| Hispanic | 72 | 54.5% |
| White | 55 | 41.7% |
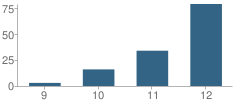
Number of Students Per Grade
| Number | Percent | |
|---|---|---|
| 9th Grade | 3 | 2.3% |
| 10th Grade | 16 | 12.1% |
| 11th Grade | 34 | 25.8% |
| 12th Grade | 79 | 59.8% |
Faculty Educational Background (2006-07)
- Teachers with a Bachelor's Degree: -
- Teachers with a Master's Degree or Higher:80%
Faculty Salary and Experience (2006-2007)
- Average Teaching Experience: 16 Years
- Average Salary: $45,956
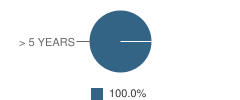
Teacher Experience by Number of Years
| Salary | Percent | |
|---|---|---|
| 1-5 Years of Teaching Experience | - | - |
| More Than 5 Years of Teaching Experience | $49,248 | 80% |
Source: AZ Department of Education, Source: NCES 2009-2010
School Ratings and Reviews
Be The First To Review Mt Graham High School!
School Map and Similar Schools Nearby
Click to Activate Map of Nearby School Campuses
Private
Public
This School
Similar Schools Nearby
| Safford High School 9-12 | 780 Students | 1.9 miles away |  3 out of 5 | |
| Thatcher High School 9-12 | 378 Students | 3.6 miles away | Not Yet Rated | |
| Pima Junior High School 7-8 | 129 Students | 8.9 miles away | Not Yet Rated | |
| Pima High School 9-12 | 210 Students | 9.1 miles away |  5 out of 5 | |
| Fort Thomas High School 7-12 | 219 Students | 21.7 miles away | Not Yet Rated | |
| Morenci Junior / Senior High School 7-12 | 497 Students | 28.4 miles away | Not Yet Rated | |
| Clifton High School 9-12 | 37 Students | 29.6 miles away |  4 out of 5 | |
Compare This School To Nearby Schools ->
School Community Forum

Join a discussion about Mt Graham High School and talk to others in the community including students, parents, teachers, and administrators.
Popular Discussion Topics
- Admissions and Registration Questions (e.g. Dress Code and Discipline Policy)
- School Calendar and Upcoming Events (e.g. Graduation)
- After School Programs, Extracurricular Activities, and Athletics (e.g. Football)
- News and Announcements (e.g. Yearbook and Class Supply List Details)
- Graduate and Alumni Events (e.g. Organizing Class Reunions)
Navigation
Can't Find What You Are Looking For?
Nearby Cities
Sponsored Links
K-12 Articles

Teaching Your Kids About Respect, Values and Violence
These days it seems that every newscast reports at least once incident of violence. As parents, we...
These days it seems that every newscast reports at least once incident of violence. As parents, we...

Teach Your Child to Write Well
When American children head off to junior kindergarten, they must be ready to learn. It is your...
When American children head off to junior kindergarten, they must be ready to learn. It is your...

Those Pesky Little Transitions
Transitions are rarely easy, yet we have to encounter them every day of our lives. For school-aged...
Transitions are rarely easy, yet we have to encounter them every day of our lives. For school-aged...