Maplewood Middle School
Rating
Not Available
Not Available

4 out of 5 | 1 Review
Find Old Friends From Maplewood Middle School
Use the form below to search for alumni from Maplewood Middle School.
School Description
School Summary and Highlights
- Enrolls 1,106 preschool, elementary, and middle school students from grades PK-8
- Ranks 135th out of 419 middle schools in LA.
Additional Contact Information
- Principal or Admin: Margaret Goode
School Operational Details
- Title I EligibleAll students of this school are eligible for participation in authorized programs.
School District Details
- Calcasieu Parish School Board District
- Per-Pupil Spending: $9,500
- Graduation Rate: 66.9%
- Dropout Rate: 4.3%
- Students Per Teacher: 13.5
- Enrolled Students: 32,853
Faculty Details and Student Enrollment
Students and Faculty
- Total Students Enrolled: 1,106
- Total Full Time "Equivalent" Teachers: 79.7
- Average Student-To-Teacher Ratio: 13.9
Students Gender Breakdown
- Males: 548 (49.5%)
- Females: 558 (50.5%)
Free Lunch Student Eligibility Breakdown
- Eligible for Reduced Lunch: 98 (8.9%)
- Eligible for Free Lunch: 398 (36.0%)
- Eligible for Either Reduced or Free Lunch: 496 (44.8%)
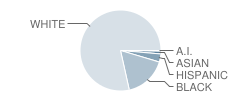
Student Enrollment Distribution by Race / Ethnicity
| Number | Percent | |
|---|---|---|
| American Indian | 3 | 0.3% |
| Black | 187 | 16.9% |
| Asian | 12 | 1.1% |
| Hispanic | 36 | 3.3% |
| White | 868 | 78.5% |
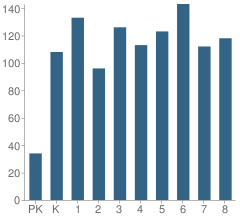
Number of Students Per Grade
| Number | Percent | |
|---|---|---|
| Pre-Kindergarten | 34 | 3.1% |
| Kindergarten | 108 | 9.8% |
| 1st Grade | 133 | 12.0% |
| 2nd Grade | 96 | 8.7% |
| 3rd Grade | 126 | 11.4% |
| 4th Grade | 113 | 10.2% |
| 5th Grade | 123 | 11.1% |
| 6th Grade | 143 | 12.9% |
| 7th Grade | 112 | 10.1% |
| 8th Grade | 118 | 10.7% |
Faculty Educational Background (2006-07)
- Teachers with a Bachelor's Degree: 75%
- Teachers with a Master's Degree or Higher:25%
Faculty Salary and Experience (2006-2007)
- Average Teaching Experience: 15 Years
- Average Salary: $42,058
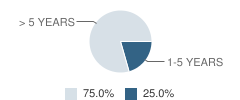
Teacher Experience by Number of Years
| Salary | Percent | |
|---|---|---|
| 1-5 Years of Teaching Experience | $36,768 | 25% |
| More Than 5 Years of Teaching Experience | $43,822 | 75% |
Source: LA Department of Education, Source: NCES 2009-2010
School Ratings and Reviews
Overall Rating: 4

4 out of 5 | 1 Review
The Overall Rating is the school's average rating from parents, students, school faculty and staff. The highest rating is five apples and the lowest is one apple.
Share Your Review About This School
1 review for Maplewood Middle School
- Reviewed by Former Student on August 02, 2009
- Rating:
 (4 / 5) Flag as inappropriate
 - I attended this school K-8 and I loved it (with the exception of 2 teachers my parents and I had problems with when I was very little). I had a great time at this school and my parents were able to be very involved. I will be sending my children to this school and happy about it! Go Comets!
School Map and Similar Schools Nearby
Click to Activate Map of Nearby School Campuses
Private
Public
This School
Similar Schools Nearby
| W. W. Lewis Middle School 6-8 | 811 Students | 2.4 miles away |  5 out of 5 | |
| Sulphur High School 8-12 | 1,868 Students | 3.2 miles away | Not Yet Rated | |
| Leblanc Middle School 6-8 | 359 Students | 3.9 miles away |  4 out of 5 | |
| Westlake High School 8-12 | 460 Students | 4.2 miles away | 5 out of 5 | |
| S. P. Arnett Middle School 6-8 | 401 Students | 4.2 miles away | Not Yet Rated | |
| Alfred M. Barbe High School 8-12 | 1,938 Students | 5.3 miles away | 4 out of 5 | |
| S. J. Welsh Middle School 6-8 | 1,327 Students | 5.8 miles away | Not Yet Rated | |
| Lagrange High School 8-12 | 1,050 Students | 7.2 miles away | Not Yet Rated | |
| Reynaud Middle School 6-8 | 139 Students | 7.4 miles away | Not Yet Rated | |
| F. K. White Middle School 6-8 | 599 Students | 7.7 miles away | Not Yet Rated | |
Compare This School To Nearby Schools ->
School Community Forum

Join a discussion about Maplewood Middle School and talk to others in the community including students, parents, teachers, and administrators.
Popular Discussion Topics
- Admissions and Registration Questions (e.g. Dress Code and Discipline Policy)
- School Calendar and Upcoming Events (e.g. Graduation)
- After School Programs, Extracurricular Activities, and Athletics (e.g. Football)
- News and Announcements (e.g. Yearbook and Class Supply List Details)
- Graduate and Alumni Events (e.g. Organizing Class Reunions)
Navigation
Can't Find What You Are Looking For?
Rankings
Nearby Cities
Sponsored Links
K-12 Articles

The Importance of Reading for Children Preschool to Grade Three
The first teachers of children are their parents. From the time they are infants, children need to...
The first teachers of children are their parents. From the time they are infants, children need to...

Beating the Summer Slump
“The Summer Slump”, teachers call it. It happens every year. It makes its way into lesson plans...
“The Summer Slump”, teachers call it. It happens every year. It makes its way into lesson plans...

Hurt: A Book Report
My last book report was over 15 years ago, and I’m a bit rusty, but here goes (Don’t forget: book...
My last book report was over 15 years ago, and I’m a bit rusty, but here goes (Don’t forget: book...