Pelican All Saints High School
Rating
Not Available
Not Available

2.5 out of 5 | 6 Reviews
Find Old Friends From Pelican All Saints High School
Use the form below to search for alumni from Pelican All Saints High School.
School Description
School Summary and Highlights
- Enrolls 170 school students from grades PK-12
- Ranks 170th out of 290 high schools in LA.
Additional Contact Information
- Mailing Address: 200 All Saints Road, Pelican, LA 71063
- Principal or Admin: Tamekia Smith
- Fax: (318) 755-2066
School Operational Details
- Title I EligibleAll students of this school are eligible for participation in authorized programs.
School District Details
- Desoto Parish School Board District
- Per-Pupil Spending: $11,431
- Graduation Rate: 61.0%
- Dropout Rate: 8.5%
- Students Per Teacher: 12.9
- Enrolled Students: 4,884
Faculty Details and Student Enrollment
Students and Faculty
- Total Students Enrolled: 170
- Total Full Time "Equivalent" Teachers: 14.5
- Average Student-To-Teacher Ratio: 11.8
Students Gender Breakdown
- Males: 80 (47.1%)
- Females: 90 (52.9%)
Free Lunch Student Eligibility Breakdown
- Eligible for Reduced Lunch: 15 (8.8%)
- Eligible for Free Lunch: 139 (81.8%)
- Eligible for Either Reduced or Free Lunch: 154 (90.6%)
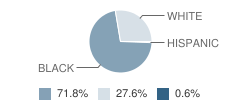
Student Enrollment Distribution by Race / Ethnicity
| Number | Percent | |
|---|---|---|
| American Indian | - | - |
| Black | 122 | 71.8% |
| Asian | - | - |
| Hispanic | 1 | 0.6% |
| White | 47 | 27.6% |
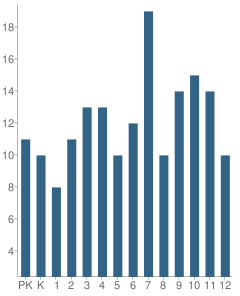
Number of Students Per Grade
| Number | Percent | |
|---|---|---|
| Pre-Kindergarten | 11 | 6.5% |
| Kindergarten | 10 | 5.9% |
| 1st Grade | 8 | 4.7% |
| 2nd Grade | 11 | 6.5% |
| 3rd Grade | 13 | 7.6% |
| 4th Grade | 13 | 7.6% |
| 5th Grade | 10 | 5.9% |
| 6th Grade | 12 | 7.1% |
| 7th Grade | 19 | 11.2% |
| 8th Grade | 10 | 5.9% |
| 9th Grade | 14 | 8.2% |
| 10th Grade | 15 | 8.8% |
| 11th Grade | 14 | 8.2% |
| 12th Grade | 10 | 5.9% |
Faculty Educational Background (2006-07)
- Teachers with a Bachelor's Degree: 75%
- Teachers with a Master's Degree or Higher:25%
Faculty Salary and Experience (2006-2007)
- Average Teaching Experience: 23 Years
- Average Salary: $48,792
Teacher Experience by Number of Years

| Salary | Percent | |
|---|---|---|
| 1-5 Years of Teaching Experience | - | - |
| More Than 5 Years of Teaching Experience | $48,792 | 100% |
Source: LA Department of Education, Source: NCES 2009-2010
School Ratings and Reviews
Overall Rating: 2.5

2.5 out of 5 | 6 Reviews
The Overall Rating is the school's average rating from parents, students, school faculty and staff. The highest rating is five apples and the lowest is one apple.
Share Your Review About This School
6 reviews for Pelican All Saints High School
- Reviewed by Parent or Guardian on June 21, 2011
- Rating:
 (1 / 5) Flag as inappropriate
 - Pelican needs a lot of help. Lack of Teachers per grade. Lack of control of Students. Attitude of Teachers and other Staff members. Principal needs Help. Not all the Children are bad, but the ones that are picked on do not get the help they need when staff members just stand by and watch. Not all Teachers are bad. The majority of them need evaluations. I do not recommend sending any child to the school till improvements are done. The school may be small but the Attitude and Environment is not becoming of a school. It Lacks several things.
- Reviewed by Student on July 29, 2010
- Rating: (1 / 5) Flag as inappropriate
- I hate this school. my brother has autism and every one talks about beating him up. I'm glad i'm moving.
- Reviewed by Student on October 31, 2008
- Rating:
 (2 / 5) Flag as inappropriate
 - I would rate this school as an okay school.We are lacking teachers.We dont have a Biology teacher so we have to take it through compress video and take Spanish online.We are very small.I probably wont enroll my kids at Pelican All Saints High School.
- Reviewed by Student on October 06, 2008
- Rating:
 (5 / 5) Flag as inappropriate
 - Well as you know Pelican is a great place.At Pelcain All Saints you do learn alot because we are small but things get around quick.People at Pelican ,girls and boys are sometimes two faced but me i look over them then they try and start talking to you, but far as learning wise Pelican is a great place to go to school at and Mrs.Smith is a GREAT principal who cares for us and pir education the teachers also care for us to that's why they are out here.Well the bell just rung and it's time to go see you later.
~I LOVE PELICAN ALL SAINTS HIGH SCHOOL~
- Reviewed by Student on September 12, 2008
- Rating: (5 / 5) Flag as inappropriate
- I LOVE PELICAN ALL SAINTS HIGH SCHOOL U LEARN MORE BECAUSE WHERE SMALL...I BEEN GOING MY WHOLE LIFE AND I LOVE IT...U KNOW EVERYONE AND THEY WAYS...I LOVE MRS.SMITH
- Reviewed by Former Student on November 07, 2007
- Rating: (2 / 5) Flag as inappropriate
- This school isn't the worst, but definitely isn't the best. While I was there, I was picked on a lot and I think that wasn't right, the students there are okay they just need to learn to accept change, and people for who they are not how they look or where they come from. The staff really could use a lot of improvement............
Read All 6 Reviews ->
School Map and Similar Schools Nearby
Click to Activate Map of Nearby School Campuses
Private
Public
This School
Similar Schools Nearby
| Pleasant Hill High School PK-12 | 307 Students | 6.2 miles away | Not Yet Rated | |
| Converse High School PK-12 | 489 Students | 9.3 miles away | Not Yet Rated | |
| Mansfield High School 8-12 | 413 Students | 13.0 miles away |  4 out of 5 | |
| Marthaville Elementary / Jr. High School PK-8 | 375 Students | 13.9 miles away | Not Yet Rated | |
| Red River High School 9-12 | 347 Students | 17.1 miles away | Not Yet Rated | |
| Red River Junior High School 6-8 | 303 Students | 17.1 miles away | 4 out of 5 | |
| Zwolle High School 7-12 | 294 Students | 17.4 miles away |  3 out of 5 | |
| Ebarb School PK-12 | 326 Students | 20.0 miles away |  3.5 out of 5 | |
| Stanley High School PK-12 | 372 Students | 20.4 miles away | 3.5 out of 5 | |
| Many High School 9-12 | 263 Students | 21.4 miles away | Not Yet Rated | |
Compare This School To Nearby Schools ->
School Community Forum

Join a discussion about Pelican All Saints High School and talk to others in the community including students, parents, teachers, and administrators.
Popular Discussion Topics
- Admissions and Registration Questions (e.g. Dress Code and Discipline Policy)
- School Calendar and Upcoming Events (e.g. Graduation)
- After School Programs, Extracurricular Activities, and Athletics (e.g. Football)
- News and Announcements (e.g. Yearbook and Class Supply List Details)
- Graduate and Alumni Events (e.g. Organizing Class Reunions)
Navigation
Can't Find What You Are Looking For?
Rankings
Nearby Cities
Sponsored Links
K-12 Articles

How to Get the Best Supplies for Your Money
School supply lists can seem unending, and the price can add up very quickly. But do we really...
School supply lists can seem unending, and the price can add up very quickly. But do we really...

National Memories
Few events are seared into our memory, and bring the country together-not as Democrat and...
Few events are seared into our memory, and bring the country together-not as Democrat and...

The Importance of Ninth Grade
Students who are entering ninth grade do not realize the importance of the critical decisions they...
Students who are entering ninth grade do not realize the importance of the critical decisions they...