Seligman Elementary School
Rating
Not Available
Not Available

No Reviews Yet
Find Old Friends From Seligman Elementary School
Use the form below to search for alumni from Seligman Elementary School.
School Description
School Summary and Highlights
- Enrolls 96 elementary school students from grades KG-8
- Ranks 522nd out of 660 middle schools in AZ.
Additional Contact Information
- Mailing Address: P.o. Box 650, Seligman, AZ 86337
School Operational Details
- Title I Eligible
School District Details
- Seligman Unified District
- Per-Pupil Spending: $16,156
- Graduation Rate: 61.5%
- Dropout Rate: 11.6%
- Students Per Teacher: 9.5
- Enrolled Students: 163
Faculty Details and Student Enrollment
Students and Faculty
- Total Students Enrolled: 96
- Total Full Time "Equivalent" Teachers: 11.9
- Average Student-To-Teacher Ratio: 8.1
Students Gender Breakdown
- Males: 51 (53.1%)
- Females: 45 (46.9%)
Free Lunch Student Eligibility Breakdown
- Eligible for Reduced Lunch: 9 (9.4%)
- Eligible for Free Lunch: 51 (53.1%)
- Eligible for Either Reduced or Free Lunch: 60 (62.5%)
Student Enrollment Distribution by Race / Ethnicity
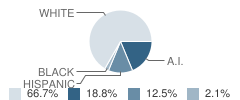
| Number | Percent | |
|---|---|---|
| American Indian | 18 | 18.8% |
| Black | 2 | 2.1% |
| Asian | - | - |
| Hispanic | 12 | 12.5% |
| White | 64 | 66.7% |
Number of Students Per Grade
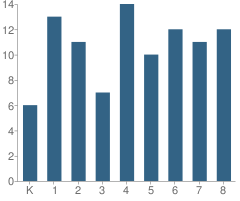
| Number | Percent | |
|---|---|---|
| Kindergarten | 6 | 6.3% |
| 1st Grade | 13 | 13.5% |
| 2nd Grade | 11 | 11.5% |
| 3rd Grade | 7 | 7.3% |
| 4th Grade | 14 | 14.6% |
| 5th Grade | 10 | 10.4% |
| 6th Grade | 12 | 12.5% |
| 7th Grade | 11 | 11.5% |
| 8th Grade | 12 | 12.5% |
Faculty Educational Background (2006-07)
- Teachers with a Bachelor's Degree: 71%
- Teachers with a Master's Degree or Higher:-
Faculty Salary and Experience (2006-2007)
- Average Teaching Experience: 7 Years
- Average Salary: $37,767
Teacher Experience by Number of Years
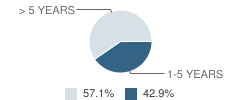
| Salary | Percent | |
|---|---|---|
| 1-5 Years of Teaching Experience | $36,456 | 43% |
| More Than 5 Years of Teaching Experience | $38,751 | 57% |
Source: AZ Department of Education, Source: NCES 2009-2010
School Ratings and Reviews
Be The First To Review Seligman Elementary School!
School Map and Similar Schools Nearby
Click to Activate Map of Nearby School Campuses
Private
Public
This School
Similar Schools Nearby
| Ash Fork Elementary School KG-5 | 136 Students | 23.2 miles away | Not Yet Rated | |
Compare This School To Nearby Schools ->
Navigation
Can't Find What You Are Looking For?
Sponsored Links
K-12 Articles

The Importance of Ninth Grade
Students who are entering ninth grade do not realize the importance of the critical decisions they...
Students who are entering ninth grade do not realize the importance of the critical decisions they...

The Very Best Things in the World
A recent poll in the U.K. revealed that children view the “very best thing in the world” as being...
A recent poll in the U.K. revealed that children view the “very best thing in the world” as being...

What to Do when Your Student is Held Back
Kids develop at different speeds, and everyone has different skills and abilities. School is easy...
Kids develop at different speeds, and everyone has different skills and abilities. School is easy...