Hathaway High School
Rating
Not Available
Not Available

No Reviews Yet
Find Old Friends From Hathaway High School
Use the form below to search for alumni from Hathaway High School.
School Description
School Summary and Highlights
- Enrolls 500 school students from grades PK-12
- Ranks 18th out of 290 high schools in LA.
Additional Contact Information
- Mailing Address: 4040 Pine Island Highway, Jennings, LA 70546
- Principal or Admin: Mona Miller
- Fax: (337) 824-2769
School Operational Details
- Title I EligibleAll students of this school are eligible for participation in authorized programs.
School District Details
- Jefferson Davis Parish School Board District
- Per-Pupil Spending: $9,622
- Graduation Rate: 70.8%
- Dropout Rate: 0.5%
- Students Per Teacher: 15.3
- Enrolled Students: 5,861
Faculty Details and Student Enrollment
Students and Faculty
- Total Students Enrolled: 500
- Total Full Time "Equivalent" Teachers: 38.8
- Average Student-To-Teacher Ratio: 12.9
Students Gender Breakdown
- Males: 248 (49.6%)
- Females: 252 (50.4%)
Free Lunch Student Eligibility Breakdown
- Eligible for Reduced Lunch: 69 (13.8%)
- Eligible for Free Lunch: 146 (29.2%)
- Eligible for Either Reduced or Free Lunch: 215 (43.0%)
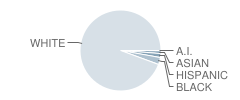
Student Enrollment Distribution by Race / Ethnicity
| Number | Percent | |
|---|---|---|
| American Indian | 1 | 0.2% |
| Black | 14 | 2.8% |
| Asian | 5 | 1.0% |
| Hispanic | 8 | 1.6% |
| White | 472 | 94.4% |
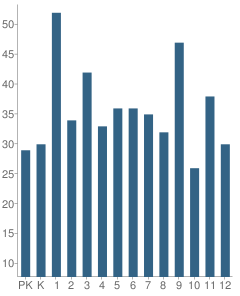
Number of Students Per Grade
| Number | Percent | |
|---|---|---|
| Pre-Kindergarten | 29 | 5.8% |
| Kindergarten | 30 | 6.0% |
| 1st Grade | 52 | 10.4% |
| 2nd Grade | 34 | 6.8% |
| 3rd Grade | 42 | 8.4% |
| 4th Grade | 33 | 6.6% |
| 5th Grade | 36 | 7.2% |
| 6th Grade | 36 | 7.2% |
| 7th Grade | 35 | 7.0% |
| 8th Grade | 32 | 6.4% |
| 9th Grade | 47 | 9.4% |
| 10th Grade | 26 | 5.2% |
| 11th Grade | 38 | 7.6% |
| 12th Grade | 30 | 6.0% |
Faculty Educational Background (2006-07)
- Teachers with a Bachelor's Degree: 55%
- Teachers with a Master's Degree or Higher:45%
Faculty Salary and Experience (2006-2007)
- Average Teaching Experience: 20 Years
- Average Salary: $43,800
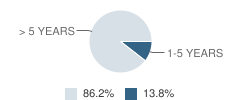
Teacher Experience by Number of Years
| Salary | Percent | |
|---|---|---|
| 1-5 Years of Teaching Experience | $36,525 | 14% |
| More Than 5 Years of Teaching Experience | $44,964 | 86% |
Source: LA Department of Education, Source: NCES 2009-2010
School Ratings and Reviews
Be The First To Review Hathaway High School!
School Map and Similar Schools Nearby
Click to Activate Map of Nearby School Campuses
Private
Public
This School
Similar Schools Nearby
| Jennings High School 7-12 | 945 Students | 7.8 miles away |  5 out of 5 | |
| Welsh-Roanoke Junior High School 6-8 | 232 Students | 8.7 miles away | Not Yet Rated | |
| Elton High School 6-12 | 274 Students | 9.0 miles away | 5 out of 5 | |
| Basile High School 5-12 | 396 Students | 10.5 miles away | 5 out of 5 | |
| Iota High School 6-12 | 407 Students | 10.8 miles away | Not Yet Rated | |
| Welsh High School 9-12 | 294 Students | 11.5 miles away | Not Yet Rated | |
| Kinder High School 9-12 | 316 Students | 14.4 miles away | 5 out of 5 | |
| Midland High School 8-12 | 299 Students | 16.5 miles away | Not Yet Rated | |
| Lacassine High School PK-12 | 574 Students | 16.8 miles away | 5 out of 5 | |
| Eunice High School 9-12 | 634 Students | 17.0 miles away | Not Yet Rated | |
Compare This School To Nearby Schools ->
School Community Forum

Join a discussion about Hathaway High School and talk to others in the community including students, parents, teachers, and administrators.
Popular Discussion Topics
- Admissions and Registration Questions (e.g. Dress Code and Discipline Policy)
- School Calendar and Upcoming Events (e.g. Graduation)
- After School Programs, Extracurricular Activities, and Athletics (e.g. Football)
- News and Announcements (e.g. Yearbook and Class Supply List Details)
- Graduate and Alumni Events (e.g. Organizing Class Reunions)
Navigation
Can't Find What You Are Looking For?
Rankings
Nearby Cities
Sponsored Links
K-12 Articles

Internet Safety for Kids of All Ages
Kids are being introduced to the Internet at a very young age. Research for homework and school...
Kids are being introduced to the Internet at a very young age. Research for homework and school...

Idle Hands
The worst affliction affecting our kids today is not teen pregnancy, drugs and alcohol, or...
The worst affliction affecting our kids today is not teen pregnancy, drugs and alcohol, or...

The Very Best Things in the World
A recent poll in the U.K. revealed that children view the “very best thing in the world” as being...
A recent poll in the U.K. revealed that children view the “very best thing in the world” as being...