Holden High School
Rating
Not Available
Not Available

No Reviews Yet
Find Old Friends From Holden High School
Use the form below to search for alumni from Holden High School.
School Description
School Summary and Highlights
- Enrolls 705 school students from grades PK-12
- Ranks 55th out of 290 high schools in LA.
Additional Contact Information
- Mailing Address: General Delivery, Holden, LA 70744
- Principal or Admin: Paula Green
- Fax: (225) 567-5248
School Operational Details
- Title I EligibleAll students of this school are eligible for participation in authorized programs.
School District Details
- Livingston Parish School Board District
- Per-Pupil Spending: $8,215
- Graduation Rate: 68.4%
- Dropout Rate: 3.9%
- Students Per Teacher: 15.0
- Enrolled Students: 24,301
Faculty Details and Student Enrollment
Students and Faculty
- Total Students Enrolled: 705
- Total Full Time "Equivalent" Teachers: 52.4
- Average Student-To-Teacher Ratio: 13.5
Students Gender Breakdown
- Males: 350 (49.6%)
- Females: 355 (50.4%)
Free Lunch Student Eligibility Breakdown
- Eligible for Reduced Lunch: 67 (9.5%)
- Eligible for Free Lunch: 304 (43.1%)
- Eligible for Either Reduced or Free Lunch: 371 (52.6%)
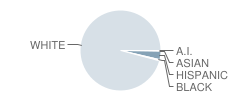
Student Enrollment Distribution by Race / Ethnicity
| Number | Percent | |
|---|---|---|
| American Indian | 1 | 0.1% |
| Black | 3 | 0.4% |
| Asian | 1 | 0.1% |
| Hispanic | 24 | 3.4% |
| White | 676 | 95.9% |
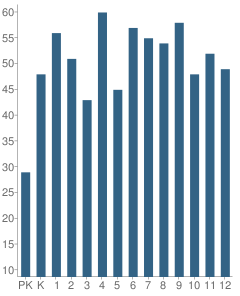
Number of Students Per Grade
| Number | Percent | |
|---|---|---|
| Pre-Kindergarten | 29 | 4.1% |
| Kindergarten | 48 | 6.8% |
| 1st Grade | 56 | 7.9% |
| 2nd Grade | 51 | 7.2% |
| 3rd Grade | 43 | 6.1% |
| 4th Grade | 60 | 8.5% |
| 5th Grade | 45 | 6.4% |
| 6th Grade | 57 | 8.1% |
| 7th Grade | 55 | 7.8% |
| 8th Grade | 54 | 7.7% |
| 9th Grade | 58 | 8.2% |
| 10th Grade | 48 | 6.8% |
| 11th Grade | 52 | 7.4% |
| 12th Grade | 49 | 7.0% |
Faculty Educational Background (2006-07)
- Teachers with a Bachelor's Degree: 60%
- Teachers with a Master's Degree or Higher:40%
Faculty Salary and Experience (2006-2007)
- Average Teaching Experience: 14 Years
- Average Salary: $41,808
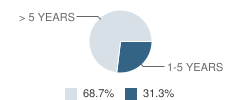
Teacher Experience by Number of Years
| Salary | Percent | |
|---|---|---|
| 1-5 Years of Teaching Experience | $38,201 | 31% |
| More Than 5 Years of Teaching Experience | $43,447 | 69% |
Source: LA Department of Education, Source: NCES 2009-2010
School Ratings and Reviews
Be The First To Review Holden High School!
School Map and Similar Schools Nearby
Click to Activate Map of Nearby School Campuses
Private
Public
This School
Similar Schools Nearby
| Doyle High School 7-12 | 496 Students | 4.4 miles away |  4 out of 5 | |
| Albany High School 8-12 | 574 Students | 5.0 miles away | Not Yet Rated | |
| Springfield High School 8-12 | 305 Students | 7.7 miles away | Not Yet Rated | |
| North Corbin Junior High School 6-8 | 612 Students | 10.2 miles away | Not Yet Rated | |
| Walker Junior High School 9 | 436 Students | 11.7 miles away | Not Yet Rated | |
| Hammond Junior High School 7-8 | 455 Students | 11.8 miles away |  3.5 out of 5 | |
| Walker High School 10-12 | 960 Students | 12.4 miles away |  5 out of 5 | |
| Westside Junior High School 6-8 | 588 Students | 12.4 miles away | Not Yet Rated | |
| Independence High School 8-12 | 534 Students | 13.8 miles away | Not Yet Rated | |
| Ponchatoula Junior High School 7-8 | 736 Students | 14.4 miles away | Not Yet Rated | |
Compare This School To Nearby Schools ->
School Community Forum

Join a discussion about Holden High School and talk to others in the community including students, parents, teachers, and administrators.
Popular Discussion Topics
- Admissions and Registration Questions (e.g. Dress Code and Discipline Policy)
- School Calendar and Upcoming Events (e.g. Graduation)
- After School Programs, Extracurricular Activities, and Athletics (e.g. Football)
- News and Announcements (e.g. Yearbook and Class Supply List Details)
- Graduate and Alumni Events (e.g. Organizing Class Reunions)
Navigation
Can't Find What You Are Looking For?
Rankings
Nearby Cities
Sponsored Links
K-12 Articles

Educators and Childhood Obesity
Obesity in childhood is rising to epidemic proportions in America and educators should be...
Obesity in childhood is rising to epidemic proportions in America and educators should be...

Help Your High School Student Create an Impressive Resume
Time has flown. Your teen is in high school and has demonstrated an interest in obtaining a part...
Time has flown. Your teen is in high school and has demonstrated an interest in obtaining a part...

The Most Used Form of Communication
Writing has, quite surprisingly, become more and more important in today’s electronic society....
Writing has, quite surprisingly, become more and more important in today’s electronic society....