Marthaville Elementary / Jr. High School
Rating
Not Available
Not Available

No Reviews Yet
Find Old Friends From Marthaville Elementary / Jr. High School
Use the form below to search for alumni from Marthaville Elementary / Jr. High School.
School Description
School Summary and Highlights
- Enrolls 375 preschool, elementary, and high school students from grades PK-8
- Ranks 179th out of 419 middle schools in LA.
Additional Contact Information
- Mailing Address: P.o. Box 148, Marthaville, LA 71450
- Principal or Admin: Terry Williams
- Fax: (318) 472-6592
School Operational Details
- Title I EligibleAll students of this school are eligible for participation in authorized programs.
School District Details
- Natchitoches Parish School Board District
- Per-Pupil Spending: $8,868
- Graduation Rate: 55.0%
- Dropout Rate: 9.4%
- Students Per Teacher: 14.5
- Enrolled Students: 6,792
Faculty Details and Student Enrollment
Students and Faculty
- Total Students Enrolled: 375
- Total Full Time "Equivalent" Teachers: 21.1
- Average Student-To-Teacher Ratio: 17.8
Students Gender Breakdown
- Males: 191 (50.9%)
- Females: 184 (49.1%)
Free Lunch Student Eligibility Breakdown
- Eligible for Reduced Lunch: 37 (9.9%)
- Eligible for Free Lunch: 208 (55.5%)
- Eligible for Either Reduced or Free Lunch: 245 (65.3%)
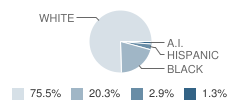
Student Enrollment Distribution by Race / Ethnicity
| Number | Percent | |
|---|---|---|
| American Indian | 5 | 1.3% |
| Black | 76 | 20.3% |
| Asian | - | - |
| Hispanic | 11 | 2.9% |
| White | 283 | 75.5% |
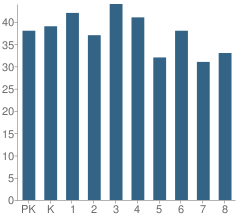
Number of Students Per Grade
| Number | Percent | |
|---|---|---|
| Pre-Kindergarten | 38 | 10.1% |
| Kindergarten | 39 | 10.4% |
| 1st Grade | 42 | 11.2% |
| 2nd Grade | 37 | 9.9% |
| 3rd Grade | 44 | 11.7% |
| 4th Grade | 41 | 10.9% |
| 5th Grade | 32 | 8.5% |
| 6th Grade | 38 | 10.1% |
| 7th Grade | 31 | 8.3% |
| 8th Grade | 33 | 8.8% |
Faculty Educational Background (2006-07)
- Teachers with a Bachelor's Degree: 73%
- Teachers with a Master's Degree or Higher:27%
Faculty Salary and Experience (2006-2007)
- Average Teaching Experience: 17 Years
- Average Salary: $46,280
Teacher Experience by Number of Years

| Salary | Percent | |
|---|---|---|
| 1-5 Years of Teaching Experience | - | - |
| More Than 5 Years of Teaching Experience | $47,346 | 87% |
Source: LA Department of Education, Source: NCES 2009-2010
School Ratings and Reviews
Be The First To Review Marthaville Elementary / Jr. High School!
School Map and Similar Schools Nearby
Click to Activate Map of Nearby School Campuses
Private
Public
This School
Similar Schools Nearby
| Pleasant Hill High School PK-12 | 307 Students | 7.8 miles away | Not Yet Rated | |
| Many High School 9-12 | 263 Students | 8.8 miles away | Not Yet Rated | |
| Many Junior High School 4-8 | 413 Students | 10.3 miles away | Not Yet Rated | |
| Zwolle High School 7-12 | 294 Students | 13.4 miles away |  3 out of 5 | |
| Pelican All Saints High School PK-12 | 170 Students | 13.9 miles away |  2.5 out of 5 | |
| Provencal Elementary & Junior High School PK-8 | 464 Students | 14.8 miles away | Not Yet Rated | |
| Converse High School PK-12 | 489 Students | 15.7 miles away | Not Yet Rated | |
| Negreet High School PK-12 | 553 Students | 19.0 miles away | Not Yet Rated | |
| Ebarb School PK-12 | 326 Students | 19.4 miles away |  3.5 out of 5 | |
| Florien High School PK-12 | 582 Students | 19.5 miles away | Not Yet Rated | |
Compare This School To Nearby Schools ->
School Community Forum

Join a discussion about Marthaville Elementary / Jr. High School and talk to others in the community including students, parents, teachers, and administrators.
Popular Discussion Topics
- Admissions and Registration Questions (e.g. Dress Code and Discipline Policy)
- School Calendar and Upcoming Events (e.g. Graduation)
- After School Programs, Extracurricular Activities, and Athletics (e.g. Football)
- News and Announcements (e.g. Yearbook and Class Supply List Details)
- Graduate and Alumni Events (e.g. Organizing Class Reunions)
Navigation
Can't Find What You Are Looking For?
Rankings
Nearby Cities
Sponsored Links
K-12 Articles

School Lunches ... Hot or Cold?
First there were four, now there are six, no one knows how many more there may be in the future....
First there were four, now there are six, no one knows how many more there may be in the future....

Where in the World is Carmen Sandiego?
One of the sensations on YouTube highlights the state of our education system. The spot was...
One of the sensations on YouTube highlights the state of our education system. The spot was...

Is Your Child's Teacher a Bully?
We've all heard about kids being bullied by peers. Kids taunt, tease, pull hair, shove and push...
We've all heard about kids being bullied by peers. Kids taunt, tease, pull hair, shove and push...