Independence Middle School
Rating
Not Available
Not Available

1 out of 5 | 1 Review
Find Old Friends From Independence Middle School
Use the form below to search for alumni from Independence Middle School.
School Description
School Summary and Highlights
- Enrolls 321 elementary and middle school students from grades 4-8
- Ranks 347th out of 419 middle schools in LA.
Additional Contact Information
- Mailing Address: P.o. Box 97, Independence, LA 70443
- Principal or Admin: Malcolm Mizell
- Fax: (985) 878-4848
School Operational Details
- Title I EligibleAll students of this school are eligible for participation in authorized programs.
School District Details
- Tangipahoa Parish School Board District
- Per-Pupil Spending: $8,213
- Graduation Rate: 70.3%
- Dropout Rate: 8.3%
- Students Per Teacher: 16.4
- Enrolled Students: 19,369
Faculty Details and Student Enrollment
Students and Faculty
- Total Students Enrolled: 321
- Total Full Time "Equivalent" Teachers: 21.2
- Average Student-To-Teacher Ratio: 15.1
Students Gender Breakdown
- Males: 177 (55.1%)
- Females: 144 (44.9%)
Free Lunch Student Eligibility Breakdown
- Eligible for Reduced Lunch: 16 (5.0%)
- Eligible for Free Lunch: 289 (90.0%)
- Eligible for Either Reduced or Free Lunch: 305 (95.0%)
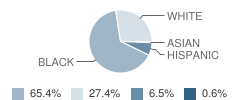
Student Enrollment Distribution by Race / Ethnicity
| Number | Percent | |
|---|---|---|
| American Indian | - | - |
| Black | 210 | 65.4% |
| Asian | 2 | 0.6% |
| Hispanic | 21 | 6.5% |
| White | 88 | 27.4% |
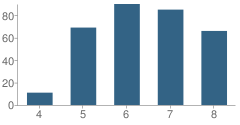
Number of Students Per Grade
| Number | Percent | |
|---|---|---|
| 4th Grade | 11 | 3.4% |
| 5th Grade | 69 | 21.5% |
| 6th Grade | 90 | 28.0% |
| 7th Grade | 85 | 26.5% |
| 8th Grade | 66 | 20.6% |
Faculty Educational Background (2006-07)
- Teachers with a Bachelor's Degree: 78%
- Teachers with a Master's Degree or Higher:22%
Faculty Salary and Experience (2006-2007)
- Average Teaching Experience: 11 Years
- Average Salary: $39,268
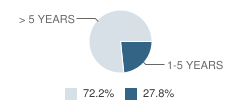
Teacher Experience by Number of Years
| Salary | Percent | |
|---|---|---|
| 1-5 Years of Teaching Experience | $35,082 | 28% |
| More Than 5 Years of Teaching Experience | $40,878 | 72% |
Source: LA Department of Education, Source: NCES 2009-2010
School Ratings and Reviews
Overall Rating: 1

1 out of 5 | 1 Review
The Overall Rating is the school's average rating from parents, students, school faculty and staff. The highest rating is five apples and the lowest is one apple.
Share Your Review About This School
1 review for Independence Middle School
- Reviewed by Student on September 11, 2009
- Rating:
 (1 / 5) Flag as inappropriate
 - IMS sucks there are so many fights and mean people
School Map and Similar Schools Nearby
Click to Activate Map of Nearby School Campuses
Private
Public
This School
Similar Schools Nearby
| Independence High School 8-12 | 534 Students | 0.7 miles away | Not Yet Rated | |
| Lucille Nesom Middle School 6-8 | 445 Students | 4.2 miles away | Not Yet Rated | |
| Amite High School 8-12 | 555 Students | 5.8 miles away | Not Yet Rated | |
| West Side Middle School 4-8 | 546 Students | 6.1 miles away |  5 out of 5 | |
| Loranger Middle School 4-8 | 591 Students | 6.3 miles away | Not Yet Rated | |
| Loranger High School 8-12 | 560 Students | 6.3 miles away | Not Yet Rated | |
| Southeastern La University Lab School KG-8 | 218 Students | 8.6 miles away | 5 out of 5 | |
| Roseland Elementary School PK-6 | 221 Students | 8.9 miles away | Not Yet Rated | |
| Hammond Junior High School 7-8 | 455 Students | 9.9 miles away |  3.5 out of 5 | |
| Albany High School 8-12 | 574 Students | 10.7 miles away | Not Yet Rated | |
Compare This School To Nearby Schools ->
School Community Forum

Join a discussion about Independence Middle School and talk to others in the community including students, parents, teachers, and administrators.
Popular Discussion Topics
- Admissions and Registration Questions (e.g. Dress Code and Discipline Policy)
- School Calendar and Upcoming Events (e.g. Graduation)
- After School Programs, Extracurricular Activities, and Athletics (e.g. Football)
- News and Announcements (e.g. Yearbook and Class Supply List Details)
- Graduate and Alumni Events (e.g. Organizing Class Reunions)
Navigation
Can't Find What You Are Looking For?
Rankings
Nearby Cities
Sponsored Links
K-12 Articles

What to Do when Your Student is Held Back
Kids develop at different speeds, and everyone has different skills and abilities. School is easy...
Kids develop at different speeds, and everyone has different skills and abilities. School is easy...

The First Day of School
The first day of kindergarten is a rite of passage for any student. Every mother cries and...
The first day of kindergarten is a rite of passage for any student. Every mother cries and...

Helping Young Children with Printing and Cursive Writing
Is your child experiencing difficulty printing or writing? Is he unable to print or write legibly,...
Is your child experiencing difficulty printing or writing? Is he unable to print or write legibly,...