Downsville High School
Rating
Not Available
Not Available

5 out of 5 | 2 Reviews
Find Old Friends From Downsville High School
Use the form below to search for alumni from Downsville High School.
School Description
School Summary and Highlights
- Enrolls 384 elementary, middle, and high school students from grades KG-12
- Ranks 109th out of 290 high schools in LA.
Additional Contact Information
- Mailing Address: P. O. Box 8, Downsville, LA 71234
- Principal or Admin: Curtis Williams
- Fax: (318) 982-5737
School Operational Details
- Title I EligibleAll students of this school are eligible for participation in authorized programs.
School District Details
- Union Local School District
- Per-Pupil Spending: $9,163
- Graduation Rate: 61.6%
- Dropout Rate: 11.1%
- Students Per Teacher: 13.5
- Enrolled Students: 2,636
Faculty Details and Student Enrollment
Students and Faculty
- Total Students Enrolled: 384
- Total Full Time "Equivalent" Teachers: 28.5
- Average Student-To-Teacher Ratio: 13.5
Students Gender Breakdown
- Males: 202 (52.6%)
- Females: 182 (47.4%)
Free Lunch Student Eligibility Breakdown
- Eligible for Reduced Lunch: 30 (7.8%)
- Eligible for Free Lunch: 170 (44.3%)
- Eligible for Either Reduced or Free Lunch: 200 (52.1%)
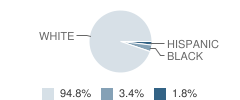
Student Enrollment Distribution by Race / Ethnicity
| Number | Percent | |
|---|---|---|
| American Indian | - | - |
| Black | 13 | 3.4% |
| Asian | - | - |
| Hispanic | 7 | 1.8% |
| White | 364 | 94.8% |
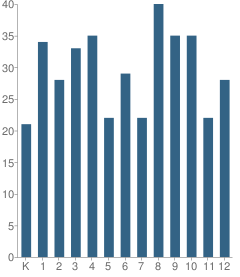
Number of Students Per Grade
| Number | Percent | |
|---|---|---|
| Kindergarten | 21 | 5.5% |
| 1st Grade | 34 | 8.9% |
| 2nd Grade | 28 | 7.3% |
| 3rd Grade | 33 | 8.6% |
| 4th Grade | 35 | 9.1% |
| 5th Grade | 22 | 5.7% |
| 6th Grade | 29 | 7.6% |
| 7th Grade | 22 | 5.7% |
| 8th Grade | 40 | 10.4% |
| 9th Grade | 35 | 9.1% |
| 10th Grade | 35 | 9.1% |
| 11th Grade | 22 | 5.7% |
| 12th Grade | 28 | 7.3% |
Faculty Educational Background (2006-07)
- Teachers with a Bachelor's Degree: 56%
- Teachers with a Master's Degree or Higher:44%
Faculty Salary and Experience (2006-2007)
- Average Teaching Experience: 16 Years
- Average Salary: $40,261
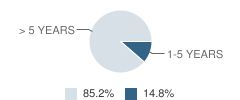
Teacher Experience by Number of Years
| Salary | Percent | |
|---|---|---|
| 1-5 Years of Teaching Experience | $31,280 | 15% |
| More Than 5 Years of Teaching Experience | $41,823 | 85% |
Source: LA Department of Education, Source: NCES 2009-2010
School Ratings and Reviews
Overall Rating: 5

5 out of 5 | 2 Reviews
The Overall Rating is the school's average rating from parents, students, school faculty and staff. The highest rating is five apples and the lowest is one apple.
Share Your Review About This School
2 reviews for Downsville High School
- Reviewed by Parent/Guardian on September 08, 2009
- Rating:
 (5 / 5) Flag as inappropriate
 - this schools tight
- Reviewed by Parent/Guardian on September 08, 2009
- Rating: (5 / 5) Flag as inappropriate
- this school is tight
School Map and Similar Schools Nearby
Click to Activate Map of Nearby School Campuses
Private
Public
This School
Similar Schools Nearby
| Choudrant High School 7-12 | 350 Students | 7.3 miles away | Not Yet Rated | |
| West Ouachita High School 8-12 | 973 Students | 9.9 miles away | Not Yet Rated | |
| Farmerville High School 9-12 | 424 Students | 14.8 miles away |  5 out of 5 | |
| Farmerville Junior High School 6-8 | 316 Students | 14.9 miles away | 5 out of 5 | |
| Ruston High School 9-12 | 1,071 Students | 15.1 miles away |  2 out of 5 | |
| West Monroe High School 8-12 | 1,867 Students | 15.3 miles away | 5 out of 5 | |
| Neville High School 9-12 | 905 Students | 15.8 miles away | Not Yet Rated | |
| Ruston Junior High School 7-8 | 564 Students | 16.6 miles away | 5 out of 5 | |
| Robert E. Lee Junior High School 7-8 | 437 Students | 16.7 miles away | Not Yet Rated | |
| Dubach High School 6-12 | 169 Students | 17.5 miles away |  4 out of 5 | |
Compare This School To Nearby Schools ->
School Community Forum

Join a discussion about Downsville High School and talk to others in the community including students, parents, teachers, and administrators.
Popular Discussion Topics
- Admissions and Registration Questions (e.g. Dress Code and Discipline Policy)
- School Calendar and Upcoming Events (e.g. Graduation)
- After School Programs, Extracurricular Activities, and Athletics (e.g. Football)
- News and Announcements (e.g. Yearbook and Class Supply List Details)
- Graduate and Alumni Events (e.g. Organizing Class Reunions)
Navigation
Can't Find What You Are Looking For?
Rankings
Nearby Cities
Sponsored Links
K-12 Articles

The Cervical Cancer Vaccine
All across North America girls between the ages of 11 and 12 have the opportunity to be vaccinated...
All across North America girls between the ages of 11 and 12 have the opportunity to be vaccinated...

Assisting Students to Overcome Test Anxiety
Every human copes with anxiety at one time or another. It is a basic emotion that we feel when...
Every human copes with anxiety at one time or another. It is a basic emotion that we feel when...

School Violence: Can It Be Stopped
It’s a fact that violence in schools is prevalent in today’s society. We hear of school shootings,...
It’s a fact that violence in schools is prevalent in today’s society. We hear of school shootings,...