Evans High School
Rating
Not Available
Not Available

No Reviews Yet
Find Old Friends From Evans High School
Use the form below to search for alumni from Evans High School.
School Description
School Summary and Highlights
- Enrolls 383 school students from grades PK-12
- Ranks 83rd out of 290 high schools in LA.
Additional Contact Information
- Mailing Address: Post Office Box 67, Evans, LA 70639
- Principal or Admin: Jimmy Maricle
- Fax: (337) 286-9298
School Operational Details
- Title I EligibleAll students of this school are eligible for participation in authorized programs.
School District Details
- Vernon Parish School Board District
- Per-Pupil Spending: $8,806
- Graduation Rate: 68.2%
- Dropout Rate: 3.5%
- Students Per Teacher: 15.4
- Enrolled Students: 9,986
Faculty Details and Student Enrollment
Students and Faculty
- Total Students Enrolled: 383
- Total Full Time "Equivalent" Teachers: 27.0
- Average Student-To-Teacher Ratio: 14.2
Students Gender Breakdown
- Males: 199 (52.0%)
- Females: 184 (48.0%)
Free Lunch Student Eligibility Breakdown
- Eligible for Reduced Lunch: 43 (11.2%)
- Eligible for Free Lunch: 179 (46.7%)
- Eligible for Either Reduced or Free Lunch: 222 (58.0%)
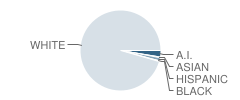
Student Enrollment Distribution by Race / Ethnicity
| Number | Percent | |
|---|---|---|
| American Indian | 10 | 2.6% |
| Black | 1 | 0.3% |
| Asian | 1 | 0.3% |
| Hispanic | 5 | 1.3% |
| White | 366 | 95.6% |
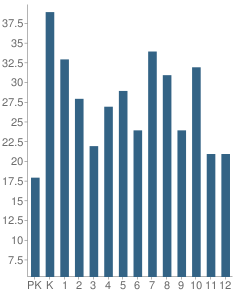
Number of Students Per Grade
| Number | Percent | |
|---|---|---|
| Pre-Kindergarten | 18 | 4.7% |
| Kindergarten | 39 | 10.2% |
| 1st Grade | 33 | 8.6% |
| 2nd Grade | 28 | 7.3% |
| 3rd Grade | 22 | 5.7% |
| 4th Grade | 27 | 7.0% |
| 5th Grade | 29 | 7.6% |
| 6th Grade | 24 | 6.3% |
| 7th Grade | 34 | 8.9% |
| 8th Grade | 31 | 8.1% |
| 9th Grade | 24 | 6.3% |
| 10th Grade | 32 | 8.4% |
| 11th Grade | 21 | 5.5% |
| 12th Grade | 21 | 5.5% |
Faculty Educational Background (2006-07)
- Teachers with a Bachelor's Degree: 69%
- Teachers with a Master's Degree or Higher:27%
Faculty Salary and Experience (2006-2007)
- Average Teaching Experience: 11 Years
- Average Salary: $35,777
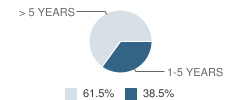
Teacher Experience by Number of Years
| Salary | Percent | |
|---|---|---|
| 1-5 Years of Teaching Experience | $31,071 | 39% |
| More Than 5 Years of Teaching Experience | $38,717 | 62% |
Source: LA Department of Education, Source: NCES 2009-2010
School Ratings and Reviews
Be The First To Review Evans High School!
School Map and Similar Schools Nearby
Click to Activate Map of Nearby School Campuses
Private
Public
This School
Similar Schools Nearby
| Merryville High School PK-12 | 554 Students | 11.6 miles away | Not Yet Rated | |
| Rosepine High School 7-12 | 526 Students | 13.0 miles away | Not Yet Rated | |
| Singer High School PK-12 | 334 Students | 18.2 miles away | Not Yet Rated | |
| South Beauregard High School 6-12 | 772 Students | 27.2 miles away |  5 out of 5 | |
Compare This School To Nearby Schools ->
School Community Forum

Join a discussion about Evans High School and talk to others in the community including students, parents, teachers, and administrators.
Popular Discussion Topics
- Admissions and Registration Questions (e.g. Dress Code and Discipline Policy)
- School Calendar and Upcoming Events (e.g. Graduation)
- After School Programs, Extracurricular Activities, and Athletics (e.g. Football)
- News and Announcements (e.g. Yearbook and Class Supply List Details)
- Graduate and Alumni Events (e.g. Organizing Class Reunions)
Navigation
Can't Find What You Are Looking For?
Rankings
Nearby Cities
Sponsored Links
K-12 Articles

Promoting Childhood Literacy
The number of American adults who are illiterate is astounding. People who lack the ability to read...
The number of American adults who are illiterate is astounding. People who lack the ability to read...

How to Get the Best Supplies for Your Money
School supply lists can seem unending, and the price can add up very quickly. But do we really...
School supply lists can seem unending, and the price can add up very quickly. But do we really...

School Violence: Can It Be Stopped
It's a fact that violence in schools is prevalent in today's society. We hear of school shootings,...
It's a fact that violence in schools is prevalent in today's society. We hear of school shootings,...