Rincon High School
Rating
Not Available
Not Available

No Reviews Yet
Find Old Friends From Rincon High School
Use the form below to search for alumni from Rincon High School.
School Description
School Summary and Highlights
- Enrolls 1,393 high school students from grades 9-12
- Ranks 230th out of 385 high schools in AZ.
School District Details
- Tucson Unified District
- Per-Pupil Spending: $7,945
- Graduation Rate: 68.8%
- Dropout Rate: 2.5%
- Students Per Teacher: 17.8
- Enrolled Students: 55,379
Faculty Details and Student Enrollment
Students and Faculty
- Total Students Enrolled: 1,393
- Total Full Time "Equivalent" Teachers: 57.0
- Average Student-To-Teacher Ratio: 24.4
Students Gender Breakdown
- Males: 753 (54.1%)
- Females: 640 (45.9%)
Free Lunch Student Eligibility Breakdown
- Eligible for Reduced Lunch: 70 (5.0%)
- Eligible for Free Lunch: 544 (39.1%)
- Eligible for Either Reduced or Free Lunch: 614 (44.1%)
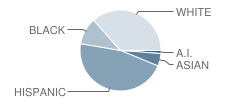
Student Enrollment Distribution by Race / Ethnicity
| Number | Percent | |
|---|---|---|
| American Indian | 17 | 1.2% |
| Black | 150 | 10.8% |
| Asian | 70 | 5.0% |
| Hispanic | 647 | 46.4% |
| White | 509 | 36.5% |
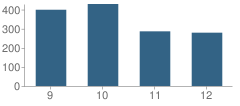
Number of Students Per Grade
| Number | Percent | |
|---|---|---|
| 9th Grade | 399 | 28.6% |
| 10th Grade | 429 | 30.8% |
| 11th Grade | 286 | 20.5% |
| 12th Grade | 279 | 20.0% |
Faculty Educational Background (2006-07)
- Teachers with a Bachelor's Degree: 37%
- Teachers with a Master's Degree or Higher:63%
Faculty Salary and Experience (2006-2007)
- Average Teaching Experience: 12 Years
- Average Salary: $43,798
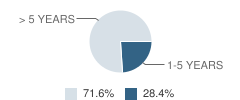
Teacher Experience by Number of Years
| Salary | Percent | |
|---|---|---|
| 1-5 Years of Teaching Experience | $34,893 | 28% |
| More Than 5 Years of Teaching Experience | $47,323 | 72% |
Source: AZ Department of Education, Source: NCES 2009-2010
School Ratings and Reviews
Be The First To Review Rincon High School!
School Map and Similar Schools Nearby
Click to Activate Map of Nearby School Campuses
Private
Public
This School
Similar Schools Nearby
| University High School 9-12 | 796 Students | 0.00 miles away | Not Yet Rated | |
| Catalina High Magnet School 9-12 | 1,326 Students | 2.0 miles away | Not Yet Rated | |
| Palo Verde High Magnet School 9-12 | 1,251 Students | 2.9 miles away |  5 out of 5 | |
| Direct Link Ii School 9-12 | 26 Students | 4.0 miles away | Not Yet Rated | |
| Tusd - Distance Learning Program School 5-12 | 50 Students | 4.1 miles away | Not Yet Rated | - |
| Tucson Magnet High School 9-12 | 2,985 Students | 4.4 miles away | 5 out of 5 | |
| Cape School-Detention 3-12 | 73 Students | 4.5 miles away | Not Yet Rated | |
| Sahuaro High School 9-12 | 1,684 Students | 4.8 miles away | Not Yet Rated | |
| Art Works Academy 9-12 | 26 Students | 5.1 miles away | Not Yet Rated | |
| Santa Rita High School 8-12 | 1,219 Students | 5.3 miles away | 5 out of 5 | |
Compare This School To Nearby Schools ->
School Community Forum

Join a discussion about Rincon High School and talk to others in the community including students, parents, teachers, and administrators.
Popular Discussion Topics
- Admissions and Registration Questions (e.g. Dress Code and Discipline Policy)
- School Calendar and Upcoming Events (e.g. Graduation)
- After School Programs, Extracurricular Activities, and Athletics (e.g. Football)
- News and Announcements (e.g. Yearbook and Class Supply List Details)
- Graduate and Alumni Events (e.g. Organizing Class Reunions)
Navigation
Can't Find What You Are Looking For?
Sponsored Links
K-12 Articles

Break the Cycle: Teen Dating Violence and Prevention Week
February 5 through 9 was "National Teen Dating Violence Awareness and Prevention Week"....
February 5 through 9 was "National Teen Dating Violence Awareness and Prevention Week"....

Those Pesky Little Transitions
Transitions are rarely easy, yet we have to encounter them every day of our lives. For school-aged...
Transitions are rarely easy, yet we have to encounter them every day of our lives. For school-aged...

Internet Safety for Kids of All Ages
Kids are being introduced to the Internet at a very young age. Research for homework and school...
Kids are being introduced to the Internet at a very young age. Research for homework and school...