Winslow High School
Rating
Not Available
Not Available

No Reviews Yet
Find Old Friends From Winslow High School
Use the form below to search for alumni from Winslow High School.
School Description
School Summary and Highlights
- Enrolls 782 high school students from grades 9-12
- Ranks 156th out of 385 high schools in AZ.
Additional Contact Information
- Mailing Address: P. O. Box 580, Winslow, AZ 86047
School Operational Details
- Title I EligibleAll students of this school are eligible for participation in authorized programs.
School District Details
- Winslow Unified District
- Per-Pupil Spending: $7,219
- Graduation Rate: 68.4%
- Dropout Rate: 6.3%
- Students Per Teacher: 18.5
- Enrolled Students: 2,252
Faculty Details and Student Enrollment
Students and Faculty
- Total Students Enrolled: 782
- Total Full Time "Equivalent" Teachers: 43.3
- Average Student-To-Teacher Ratio: 18.0
Students Gender Breakdown
- Males: 367 (46.9%)
- Females: 415 (53.1%)
Free Lunch Student Eligibility Breakdown
- Eligible for Reduced Lunch: - (-)
- Eligible for Free Lunch: 5 (0.6%)
- Eligible for Either Reduced or Free Lunch: 5 (0.6%)
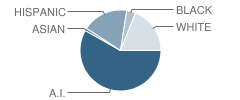
Student Enrollment Distribution by Race / Ethnicity
| Number | Percent | |
|---|---|---|
| American Indian | 455 | 58.2% |
| Black | 28 | 3.6% |
| Asian | 8 | 1.0% |
| Hispanic | 143 | 18.3% |
| White | 148 | 18.9% |
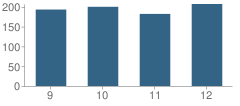
Number of Students Per Grade
| Number | Percent | |
|---|---|---|
| 9th Grade | 193 | 24.7% |
| 10th Grade | 200 | 25.6% |
| 11th Grade | 182 | 23.3% |
| 12th Grade | 207 | 26.5% |
Faculty Educational Background (2006-07)
- Teachers with a Bachelor's Degree: 52%
- Teachers with a Master's Degree or Higher:45%
Faculty Salary and Experience (2006-2007)
- Average Teaching Experience: 13 Years
- Average Salary: $41,908
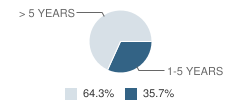
Teacher Experience by Number of Years
| Salary | Percent | |
|---|---|---|
| 1-5 Years of Teaching Experience | $36,981 | 36% |
| More Than 5 Years of Teaching Experience | $44,646 | 64% |
Source: AZ Department of Education, Source: NCES 2009-2010
School Ratings and Reviews
Be The First To Review Winslow High School!
School Map and Similar Schools Nearby
Click to Activate Map of Nearby School Campuses
Private
Public
This School
Similar Schools Nearby
| Winslow Junior High School 7-8 | 381 Students | 0.2 miles away |  3 out of 5 | |
| Joseph City Junior High School 7-8 | 74 Students | 21.3 miles away | Not Yet Rated | |
| Joseph City High School 9-12 | 157 Students | 21.3 miles away |  5 out of 5 | |
Compare This School To Nearby Schools ->
School Community Forum

Join a discussion about Winslow High School and talk to others in the community including students, parents, teachers, and administrators.
Popular Discussion Topics
- Admissions and Registration Questions (e.g. Dress Code and Discipline Policy)
- School Calendar and Upcoming Events (e.g. Graduation)
- After School Programs, Extracurricular Activities, and Athletics (e.g. Football)
- News and Announcements (e.g. Yearbook and Class Supply List Details)
- Graduate and Alumni Events (e.g. Organizing Class Reunions)
Navigation
Can't Find What You Are Looking For?
Nearby Cities
Sponsored Links
K-12 Articles

The Very Best Things in the World
A recent poll in the U.K. revealed that children view the "very best thing in the world" as being...
A recent poll in the U.K. revealed that children view the "very best thing in the world" as being...

Summer Advice
A few weeks ago, at the weekly after-school program I run through my local church, a group of...
A few weeks ago, at the weekly after-school program I run through my local church, a group of...

When Bad Report Cards Happen to Good Kids
It's mid-term season once again, and semester (or quarter or trimester) grades will be coming out...
It's mid-term season once again, and semester (or quarter or trimester) grades will be coming out...