Sedona Red Rock High School
Rating
Not Available
Not Available

4 out of 5 | 4 Reviews
Find Old Friends From Sedona Red Rock High School
Use the form below to search for alumni from Sedona Red Rock High School.
School Description
School Summary and Highlights
- Enrolls 500 high school students from grades 9-12
- Ranks 59th out of 385 high schools in AZ.
School District Details
- Sedona-Oak Creek Joint Unified District
- Per-Pupil Spending: $8,566
- Graduation Rate: 83.3%
- Dropout Rate: 3.0%
- Students Per Teacher: 17.4
- Enrolled Students: 1,303
Faculty Details and Student Enrollment
Students and Faculty
- Total Students Enrolled: 500
- Total Full Time "Equivalent" Teachers: 24.0
- Average Student-To-Teacher Ratio: 20.8
Students Gender Breakdown
- Males: 268 (53.6%)
- Females: 232 (46.4%)
Free Lunch Student Eligibility Breakdown
- Eligible for Reduced Lunch: 21 (4.2%)
- Eligible for Free Lunch: 103 (20.6%)
- Eligible for Either Reduced or Free Lunch: 124 (24.8%)
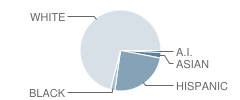
Student Enrollment Distribution by Race / Ethnicity
| Number | Percent | |
|---|---|---|
| American Indian | 4 | 0.8% |
| Black | 9 | 1.8% |
| Asian | 11 | 2.2% |
| Hispanic | 121 | 24.2% |
| White | 355 | 71.0% |
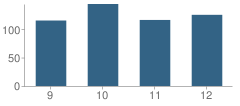
Number of Students Per Grade
| Number | Percent | |
|---|---|---|
| 9th Grade | 115 | 23.0% |
| 10th Grade | 144 | 28.8% |
| 11th Grade | 116 | 23.2% |
| 12th Grade | 125 | 25.0% |
Faculty Educational Background (2006-07)
- Teachers with a Bachelor's Degree: 66%
- Teachers with a Master's Degree or Higher:35%
Faculty Salary and Experience (2006-2007)
- Average Teaching Experience: 9 Years
- Average Salary: $42,527
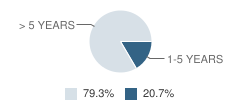
Teacher Experience by Number of Years
| Salary | Percent | |
|---|---|---|
| 1-5 Years of Teaching Experience | $36,137 | 21% |
| More Than 5 Years of Teaching Experience | $44,194 | 79% |
Source: AZ Department of Education, Source: NCES 2009-2010
School Ratings and Reviews
Overall Rating: 4

4 out of 5 | 4 Reviews
The Overall Rating is the school's average rating from parents, students, school faculty and staff. The highest rating is five apples and the lowest is one apple.
Share Your Review About This School
4 reviews for Sedona Red Rock High School
- Reviewed by Staff Member on August 17, 2010
- Rating:
 (5 / 5) Flag as inappropriate
 - Greatest HS at which I have ever worked. Staff and buildings are outstanding. Students are intelligent and should attend college after graduation. A
- Reviewed by Community Member on November 22, 2008
- Rating: (5 / 5) Flag as inappropriate
- Great teachers
- Reviewed by Former Student on September 28, 2008
- Rating:
 (1 / 5) Flag as inappropriate
 - Terrible School. Designer Bricks; No budget, staff, respect, or integrity whatsoever.
- Reviewed by Parent/Guardian on September 03, 2008
- Rating: (5 / 5) Flag as inappropriate
- its a wonderful school
School Map and Similar Schools Nearby
Click to Activate Map of Nearby School Campuses
Private
Public
This School
Similar Schools Nearby
| Mingus Union High School 9-12 | 1,281 Students | 13.6 miles away |  5 out of 5 | |
| Camp Verde High School 9-12 | 483 Students | 17.7 miles away | Not Yet Rated | |
| Juvenile Detention Education Program School 4-12 | 25 Students | 25.8 miles away | Not Yet Rated | |
| Project New Start School 7-12 | 61 Students | 26.5 miles away | Not Yet Rated | |
| Flagstaff High School 9-12 | 1,382 Students | 26.6 miles away |  4 out of 5 | |
| Sinagua High School 9-12 | 897 Students | 27.2 miles away | Not Yet Rated | |
| Ponderosa High School 9-12 | 59 Students | 28.0 miles away | Not Yet Rated | |
| Coconino High School 9-12 | 1,134 Students | 28.1 miles away |  3.5 out of 5 | |
Compare This School To Nearby Schools ->
School Community Forum

Join a discussion about Sedona Red Rock High School and talk to others in the community including students, parents, teachers, and administrators.
Popular Discussion Topics
- Admissions and Registration Questions (e.g. Dress Code and Discipline Policy)
- School Calendar and Upcoming Events (e.g. Graduation)
- After School Programs, Extracurricular Activities, and Athletics (e.g. Football)
- News and Announcements (e.g. Yearbook and Class Supply List Details)
- Graduate and Alumni Events (e.g. Organizing Class Reunions)
Navigation
Can't Find What You Are Looking For?
Nearby Cities
Sponsored Links
K-12 Articles

Attend Your Teen's Holiday Parties
Christmas and New Years are coming, and with them Christmas and New Years Eve parties. At many of...
Christmas and New Years are coming, and with them Christmas and New Years Eve parties. At many of...

Who is Safe?
Between September 26 and October 2, 2006, there were three deadly school shootings and...
Between September 26 and October 2, 2006, there were three deadly school shootings and...

Teaching Your Child Study Skills
Many children who have the capability to get good grades experience frustration because of low...
Many children who have the capability to get good grades experience frustration because of low...