Creative Technologies Academy

No Reviews Yet
Find Old Friends From Creative Technologies Academy
Use the form below to search for alumni from Creative Technologies Academy.
School Description
School Summary and Highlights
- Enrolls 310 elementary, middle, and high school students from grades KG-12
- Ranks 1322nd out of 1,745 elementary schools in MI.
Additional Contact Information
- Mailing Address: 350 Pine Street, Cedar Springs, MI 49319
School Operational Details
- Charter School
School District Details
- Creative Technologies Academy
- Per-Pupil Spending: $7,527
- Graduation Rate: 42.9%
- Students Per Teacher: 15.5
- Enrolled Students: 310
Faculty Details and Student Enrollment
Students and Faculty
- Total Students Enrolled: 310
- Total Full Time "Equivalent" Teachers: 20.0
- Average Student-To-Teacher Ratio: 15.5
Students Gender Breakdown
- Males: 162 (52.3%)
- Females: 147 (47.4%)
Free Lunch Student Eligibility Breakdown
- Eligible for Reduced Lunch: - (-)
- Eligible for Free Lunch: 57 (18.4%)
- Eligible for Either Reduced or Free Lunch: 57 (18.4%)
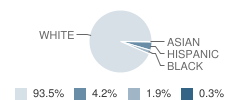
Student Enrollment Distribution by Race / Ethnicity

| Number | Percent | |
|---|---|---|
| American Indian | - | - |
| Black | 6 | 1.9% |
| Asian | 1 | 0.3% |
| Hispanic | 13 | 4.2% |
| White | 289 | 93.2% |
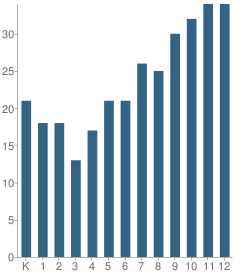
Number of Students Per Grade

| Number | Percent | |
|---|---|---|
| Kindergarten | 21 | 6.8% |
| 1st Grade | 18 | 5.8% |
| 2nd Grade | 18 | 5.8% |
| 3rd Grade | 13 | 4.2% |
| 4th Grade | 17 | 5.5% |
| 5th Grade | 21 | 6.8% |
| 6th Grade | 21 | 6.8% |
| 7th Grade | 26 | 8.4% |
| 8th Grade | 25 | 8.1% |
| 9th Grade | 30 | 9.7% |
| 10th Grade | 32 | 10.3% |
| 11th Grade | 34 | 11.0% |
| 12th Grade | 34 | 11.0% |
Source: MI Department of Education, Source: NCES 2009-2010
School Ratings and Reviews
Be The First To Review Creative Technologies Academy!
Sponsored Links
Test Scores and Performance Information
Overall School Rating
How is this determined?
The overall school rating shows that Creative Technologies Academy performed on average worse than many other schools across the state on MEAP and MME state exams in the following subjects:
- English Language Arts
- Math
- Reading
- Science
- Social Studies
- Writing
MEAP - Test Proficiency by Grade and Subject
Grade 3 - % of students at or above proficiency
| School | District | State | |
|---|---|---|---|
| Math Test | |||
| 2010 | 94.1% | 94.1% | 95.3% |
| 2009 | 100.0% | 100.0% | 94.8% |
| 2008 | 80.0% | 80.0% | 91.3% |
| Reading Test | |||
| 2010 | 58.8% | 58.8% | 86.8% |
| 2009 | 78.6% | 78.6% | 89.8% |
| 2008 | 73.3% | 73.3% | 86.4% |
| English Language Arts Test | |||
| 2008 | 66.7% | 66.7% | 83.2% |
| Writing Test | |||
| 2008 | 53.3% | 53.3% | 61.1% |
Grade 4 - % of students at or above proficiency
| School | District | State | |
|---|---|---|---|
| Math Test | |||
| 2010 | 100.0% | 100.0% | 91.5% |
| 2009 | 87.5% | 87.5% | 92.3% |
| 2008 | 76.2% | 76.2% | 87.9% |
| Reading Test | |||
| 2010 | 93.3% | 93.3% | 84.1% |
| 2009 | 43.8% | 43.8% | 84.1% |
| 2008 | 71.4% | 71.4% | 82.8% |
| Writing Test | |||
| 2010 | 40.0% | 40.0% | 47.2% |
| 2009 | - | - | - |
| 2008 | 38.1% | 38.1% | 44.4% |
| English Language Arts Test | |||
| 2008 | 66.7% | 66.7% | 76.6% |
Grade 5 - % of students at or above proficiency
| School | District | State | |
|---|---|---|---|
| Math Test | |||
| 2010 | 68.4% | 68.4% | 79.9% |
| 2009 | 85.0% | 85.0% | 79.5% |
| 2008 | 77.8% | 77.8% | 76.8% |
| Reading Test | |||
| 2010 | 52.6% | 52.6% | 85.1% |
| 2009 | 84.2% | 84.2% | 85.2% |
| 2008 | 72.2% | 72.2% | 81.5% |
| Science Test | |||
| 2010 | 63.2% | 63.2% | 78.1% |
| 2009 | 81.0% | 81.0% | 81.0% |
| 2008 | 77.8% | 77.8% | 83.1% |
| English Language Arts Test | |||
| 2008 | 72.2% | 72.2% | 78.2% |
| Writing Test | |||
| 2008 | 50.0% | 50.0% | 63.4% |
Grade 6 - % of students at or above proficiency
| School | District | State | |
|---|---|---|---|
| Math Test | |||
| 2010 | 76.2% | 76.2% | 84.5% |
| 2009 | 85.0% | 85.0% | 82.0% |
| 2008 | 76.2% | 76.2% | 79.9% |
| Reading Test | |||
| 2010 | 81.0% | 81.0% | 84.0% |
| 2009 | 80.0% | 80.0% | 87.7% |
| 2008 | 81.0% | 81.0% | 80.5% |
| Social Studies Test | |||
| 2010 | 76.2% | 76.2% | 75.3% |
| 2009 | 61.9% | 61.9% | 73.4% |
| 2008 | 76.2% | 76.2% | 73.6% |
| English Language Arts Test | |||
| 2008 | 71.4% | 71.4% | 79.5% |
| Writing Test | |||
| 2008 | 66.7% | 66.7% | 75.7% |
Grade 7 - % of students at or above proficiency
| School | District | State | |
|---|---|---|---|
| Math Test | |||
| 2010 | 73.3% | 73.3% | 84.6% |
| 2009 | 84.0% | 84.0% | 82.2% |
| 2008 | 82.6% | 82.6% | 82.6% |
| Reading Test | |||
| 2010 | 86.7% | 86.7% | 79.0% |
| 2009 | 80.0% | 80.0% | 82.0% |
| 2008 | 73.9% | 73.9% | 79.6% |
| Writing Test | |||
| 2010 | 60.0% | 60.0% | 47.8% |
| 2009 | - | - | - |
| 2008 | 65.2% | 65.2% | 77.9% |
| English Language Arts Test | |||
| 2008 | 73.9% | 73.9% | 80.1% |
Grade 8 - % of students at or above proficiency
| School | District | State | |
|---|---|---|---|
| Math Test | |||
| 2010 | 61.5% | 61.5% | 78.0% |
| 2009 | 52.0% | 52.0% | 70.3% |
| 2008 | 62.5% | 62.5% | 74.5% |
| Reading Test | |||
| 2010 | 65.4% | 65.4% | 81.9% |
| 2009 | 56.0% | 56.0% | 83.4% |
| 2008 | 62.5% | 62.5% | 75.5% |
| Science Test | |||
| 2010 | 80.8% | 80.8% | 78.1% |
| 2009 | 76.0% | 76.0% | 75.9% |
| 2008 | 70.8% | 70.8% | 76.3% |
| English Language Arts Test | |||
| 2008 | 66.7% | 66.7% | 76.7% |
| Writing Test | |||
| 2008 | 62.5% | 62.5% | 74.2% |
Grade 9 - % of students at or above proficiency
| School | District | State | |
|---|---|---|---|
| Social Studies Test | |||
| 2010 | 70.8% | 70.8% | 72.8% |
| 2009 | 70.0% | 70.0% | 71.1% |
| 2008 | 80.0% | 80.0% | 72.4% |
MME - Test Proficiency by Grade and Subject
Grade 11 - % of students at or above proficiency
| School | District | State | |
|---|---|---|---|
| Math Test | |||
| 2010 | 28.6% | 28.6% | 50.4% |
| 2009 | 37.9% | 37.9% | 49.3% |
| 2008 | 48.0% | 48.0% | 46.2% |
| Reading Test | |||
| 2010 | 48.6% | 48.6% | 65.2% |
| 2009 | 37.9% | 37.9% | 59.9% |
| 2008 | 68.0% | 68.0% | 61.9% |
| Science Test | |||
| 2010 | 51.4% | 51.4% | 57.9% |
| 2009 | 37.9% | 37.9% | 55.6% |
| 2008 | 68.0% | 68.0% | 56.6% |
| Social Studies Test | |||
| 2010 | 77.1% | 77.1% | 79.4% |
| 2009 | 69.0% | 69.0% | 81.3% |
| 2008 | 88.0% | 88.0% | 79.9% |
| Writing Test | |||
| 2010 | 20.0% | 20.0% | 43.7% |
| 2009 | 21.4% | 21.4% | 43.4% |
| 2008 | 32.0% | 32.0% | 41.1% |
| English Language Arts Test | |||
| 2009 | 21.4% | 21.4% | 52.1% |
| 2008 | 48.0% | 48.0% | 52.3% |
Source: MI Department of Education 2009-2010
School Community Forum

Join a discussion about Creative Technologies Academy and talk to others in the community including students, parents, teachers, and administrators.
Popular Discussion Topics
- Admissions and Registration Questions (e.g. Dress Code and Discipline Policy)
- School Calendar and Upcoming Events (e.g. Graduation)
- After School Programs, Extracurricular Activities, and Athletics (e.g. Football)
- News and Announcements (e.g. Yearbook and Class Supply List Details)
- Graduate and Alumni Events (e.g. Organizing Class Reunions)
Navigation
Can't Find What You Are Looking For?
Rankings
Nearby Cities
Sponsored Links
K-12 Articles
Strategies to Help Kids Cope with Stress
Many parents believe that kids don't experience stress. Nothing could be further from the truth....
Tips for Purchasing Back to School Supplies
In just a few days, kids from all over the US will be going back to school. Now is the time to take...
The Importance of Reading for Children Preschool to Grade Three
The first teachers of children are their parents. From the time they are infants, children need to...
