Climax-Scotts High School
Rating
Not Available
Not Available

5 out of 5 | 1 Review
Find Old Friends From Climax-Scotts High School
Use the form below to search for alumni from Climax-Scotts High School.
School Description
School Summary and Highlights
- Enrolls 325 middle and high school students from grades 6-12
- Ranks 410th out of 672 high schools in MI.
Additional Contact Information
- Mailing Address: 372 S. Main Street, Climax, MI 49034
- Principal or Admin: Mr. Ron Ehlers
- Fax: (269) 746-4142
- Website: www.remc12.k12.mi.us
School Operational Details
- Title I Eligible
School District Details
- Climax-Scotts Community Schools District
- Per-Pupil Spending: $8,062
- Graduation Rate: 83.9%
- Dropout Rate: 16.3%
- Students Per Teacher: 15.8
- Enrolled Students: 606
Faculty Details and Student Enrollment
Students and Faculty
- Total Students Enrolled: 325
- Total Full Time "Equivalent" Teachers: 24.8
- Average Student-To-Teacher Ratio: 13.1
Students Gender Breakdown
- Males: 173 (53.2%)
- Females: 151 (46.5%)
Free Lunch Student Eligibility Breakdown
- Eligible for Reduced Lunch: 28 (8.6%)
- Eligible for Free Lunch: 77 (23.7%)
- Eligible for Either Reduced or Free Lunch: 105 (32.3%)
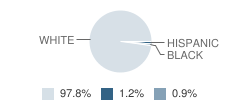
Student Enrollment Distribution by Race / Ethnicity
| Number | Percent | |
|---|---|---|
| American Indian | - | - |
| Black | 3 | 0.9% |
| Asian | - | - |
| Hispanic | 4 | 1.2% |
| White | 317 | 97.5% |
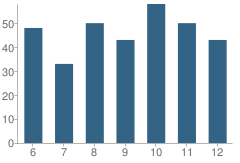
Number of Students Per Grade
| Number | Percent | |
|---|---|---|
| 6th Grade | 48 | 14.8% |
| 7th Grade | 33 | 10.2% |
| 8th Grade | 50 | 15.4% |
| 9th Grade | 43 | 13.2% |
| 10th Grade | 58 | 17.8% |
| 11th Grade | 50 | 15.4% |
| 12th Grade | 43 | 13.2% |
Source: MI Department of Education, Source: NCES 2009-2010
School Ratings and Reviews
Overall Rating: 5

5 out of 5 | 1 Review
The Overall Rating is the school's average rating from parents, students, school faculty and staff. The highest rating is five apples and the lowest is one apple.
Share Your Review About This School
1 review for Climax-Scotts High School
- Reviewed by Student on October 25, 2007
- Rating:
 (5 / 5) Flag as inappropriate
 - this school sucks and it is really poor never ever come here
School Map and Similar Schools Nearby
Click to Activate Map of Nearby School Campuses
Private
Public
This School
Similar Schools Nearby
| Galesburg-Augusta High School 9-12 | 355 Students | 5.6 miles away |  5 out of 5 | |
| Lakeview High School 9-12 | 1,372 Students | 6.3 miles away | Not Yet Rated | |
| Lakeview Junior High School 5-8 | 1,182 Students | 7.0 miles away | Not Yet Rated | |
| Harper Creek High School 9-12 | 932 Students | 9.7 miles away | Not Yet Rated | |
| Battle Creek Central High School 9-12 | 1,341 Students | 9.9 miles away |  4.5 out of 5 | |
| Gull Lake High School 9-12 | 932 Students | 10.8 miles away | Not Yet Rated | |
| Athens High School 9-12 | 205 Students | 11.5 miles away | Not Yet Rated | |
| Kalamazoo Resa School KG-12 | 18 Students | 12.0 miles away | Not Yet Rated | - |
| Loy Norrix High School 9-12 | 1,277 Students | 12.2 miles away | 5 out of 5 | |
| Vicksburg High School 9-12 | 858 Students | 12.9 miles away | Not Yet Rated | |
Compare This School To Nearby Schools ->
School Community Forum

Join a discussion about Climax-Scotts High School and talk to others in the community including students, parents, teachers, and administrators.
Popular Discussion Topics
- Admissions and Registration Questions (e.g. Dress Code and Discipline Policy)
- School Calendar and Upcoming Events (e.g. Graduation)
- After School Programs, Extracurricular Activities, and Athletics (e.g. Football)
- News and Announcements (e.g. Yearbook and Class Supply List Details)
- Graduate and Alumni Events (e.g. Organizing Class Reunions)
Navigation
Can't Find What You Are Looking For?
Rankings
Nearby Cities
Sponsored Links
K-12 Articles

Cut the Credit and Save You Some Money
Today’s society glorifies a get-it-now mentality. Children learn this early. You probably noticed...
Today’s society glorifies a get-it-now mentality. Children learn this early. You probably noticed...

Strategies to Help Kids Cope with Stress
Many parents believe that kids don’t experience stress. Nothing could be further from the truth....
Many parents believe that kids don’t experience stress. Nothing could be further from the truth....

Help Your High School Student Create an Impressive Resume
Time has flown. Your teen is in high school and has demonstrated an interest in obtaining a part...
Time has flown. Your teen is in high school and has demonstrated an interest in obtaining a part...