Blytheville Charter School
Rating
Not Available
Not Available

5 out of 5 | 1 Review
Find Old Friends From Blytheville Charter School
Use the form below to search for alumni from Blytheville Charter School.
School Description
School Summary and Highlights
- Enrolls 95 middle and high school students from grades 7-12
Additional Contact Information
- Mailing Address: 415 Tennessee, Blytheville, AR 72315
- Principal or Admin: Mrs. Barbara A. Lewis
- Fax: (870) 762-0172
- Website: bytheville.k12.ar.us
School Operational Details
- Alternative School
- Title I EligibleAll students of this school are eligible for participation in authorized programs.
- Charter School
School District Details
- Blytheville School District
- Per-Pupil Spending: $8,780
- Graduation Rate: 58.4%
- Dropout Rate: 8.5%
- Students Per Teacher: 13.5
- Enrolled Students: 3,062
Faculty Details and Student Enrollment
Students and Faculty
- Total Students Enrolled: 95
- Total Full Time "Equivalent" Teachers: 11.4
- Average Student-To-Teacher Ratio: 7.9
Students Gender Breakdown
- Males: 64 (67.4%)
- Females: 31 (32.6%)
Free Lunch Student Eligibility Breakdown
- Eligible for Reduced Lunch: - (-)
- Eligible for Free Lunch: 92 (96.8%)
- Eligible for Either Reduced or Free Lunch: 92 (96.8%)
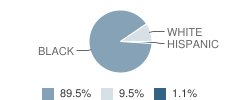
Student Enrollment Distribution by Race / Ethnicity
| Number | Percent | |
|---|---|---|
| American Indian | - | - |
| Black | 85 | 89.5% |
| Asian | - | - |
| Hispanic | 1 | 1.1% |
| White | 9 | 9.5% |
Number of Students Per Grade

| Number | Percent | |
|---|---|---|
| 7th Grade | 11 | 11.6% |
| 8th Grade | 21 | 22.1% |
| 9th Grade | 23 | 24.2% |
| 10th Grade | 22 | 23.2% |
| 11th Grade | 8 | 8.4% |
| 12th Grade | 10 | 10.5% |
Source: AR Department of Education, Source: NCES 2009-2010
School Ratings and Reviews
Overall Rating: 5

5 out of 5 | 1 Review
The Overall Rating is the school's average rating from parents, students, school faculty and staff. The highest rating is five apples and the lowest is one apple.
Share Your Review About This School
1 review for Blytheville Charter School
- Reviewed by Parent/Guardian on January 11, 2009
- Rating:
 (5 / 5) Flag as inappropriate
 - Blytheville Charter School
Navigation
Can't Find What You Are Looking For?
Rankings
Nearby Cities
Sponsored Links
K-12 Articles

The First Day of School
The first day of kindergarten is a rite of passage for any student. Every mother cries and...
The first day of kindergarten is a rite of passage for any student. Every mother cries and...

Se Hablan Otras Idiomas?
In the late 1990s, the Salem-Keizer school district in Oregon began requiring every student in its...
In the late 1990s, the Salem-Keizer school district in Oregon began requiring every student in its...

School Lunches ... Hot or Cold?
First there were four, now there are six, no one knows how many more there may be in the future....
First there were four, now there are six, no one knows how many more there may be in the future....